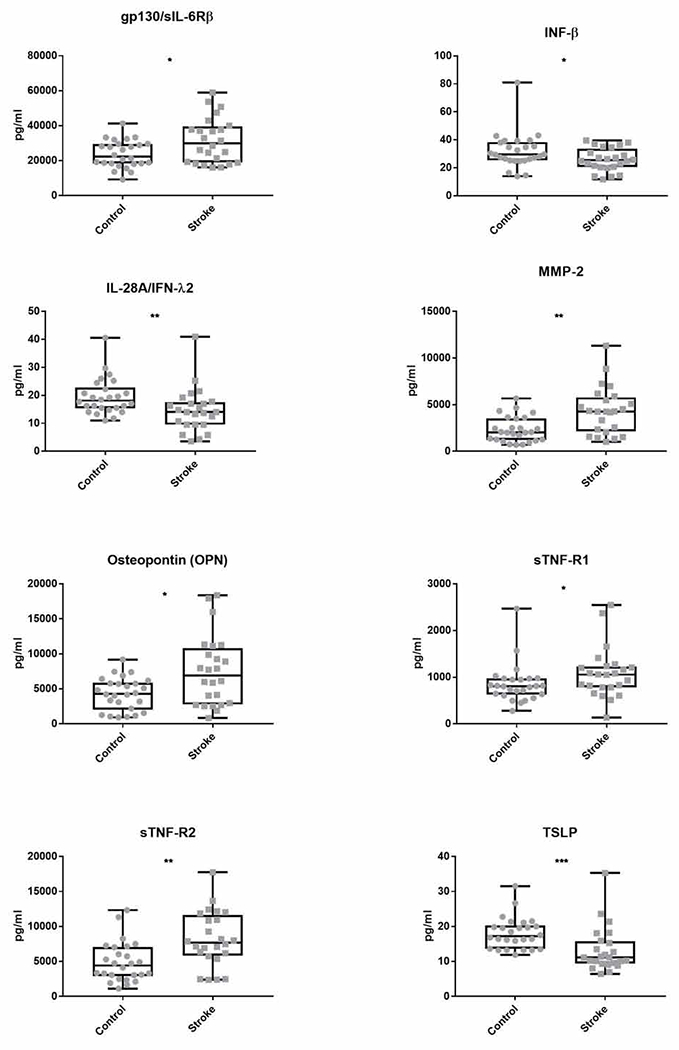
Fig 1: Significantly different immunological profiles of stroke and control patients.

Levels of 37 immunological proteins in the plasma of stroke patients and age-matched controls were determined using a multiplexed ELISA. Recorded fluorescence intensities were converted to concentrations using standard curves for each protein. Plasma concentrations, in picograms per milliliter (pg/ml), of the eight proteins that were significantly different between stroke and control populations are shown here as box and whisker plots. All concentration values are shown. Whiskers extend from minimum to maximum concentration. Box encloses the range between the first and third quartiles with horizontal line at median value. P-values calculated using post-hoc pairwise non-parametric Mann-Whitney U-test. *p≤.05 **p≤.01 ***p≤.001
