Figure 3.

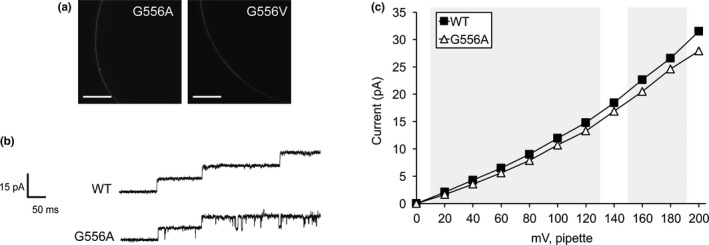
Replacing G556 with larger nonpolar residues reduces or ablates channel conductance. (a) Portions of the oocyte periphery 5 days after injection with the indicated MSL10‐GFP variant cRNA. Scale bar is 100 μm. (b) Examples of traces at −100 mV membrane potential. 0.5‐s fragments of 5‐s records of channel activation by symmetric pressure ramps are shown. (c) Current/voltage curves for wild type and MSL10 G556A. Each data point is the average current from 3 to 9 patches in 60 mM MgCl2, 4 mM HEPES. Error bars indicating standard deviation are present but are obscured by the symbols. Wild‐type MSL10 curve is from the same data as in Figure 2c. Gray background indicates voltages where the current produced by MSL10 G556A differed significantly from wild‐type MSL10, p < 0.001 (Student's t test)
