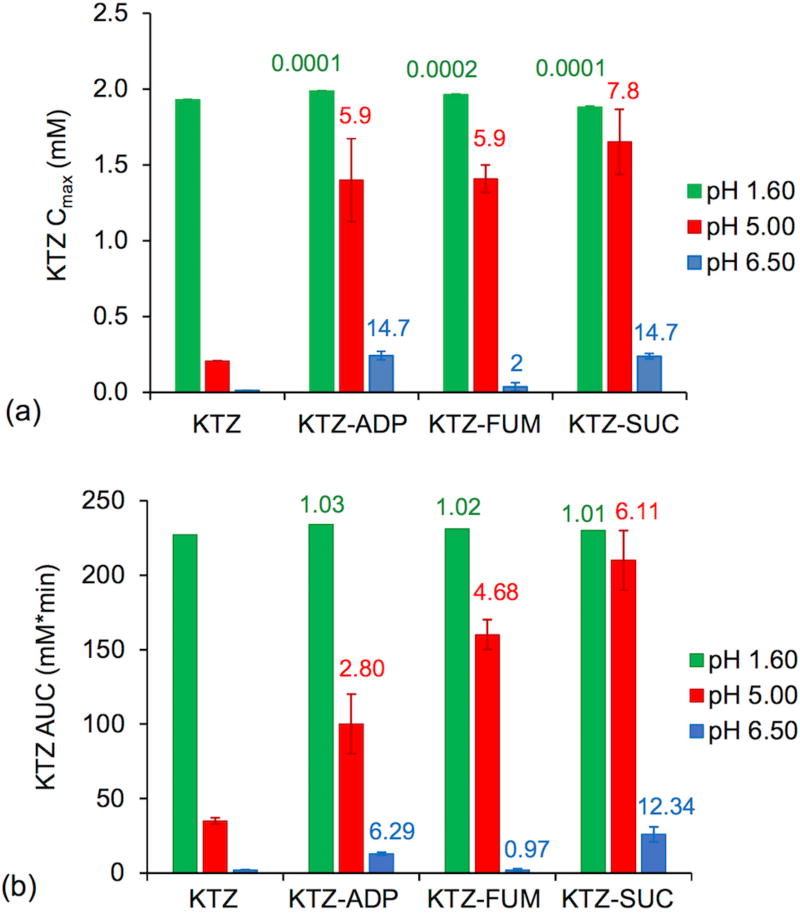
Figure 6.
(a) Cmax of KTZ during dissolution and (b) AUC of KTZ from 0 – 180 min for dissolution in pH 5.0 and 6.5 media, and from 0 – 120 min for dissolution in pH 1.6 media. Numbers on top of the columns represent (a) σmax and (b) AUC ratio of cocrystal to drug (AUCcc/drug). pH values in legend indicate initial media pH.

