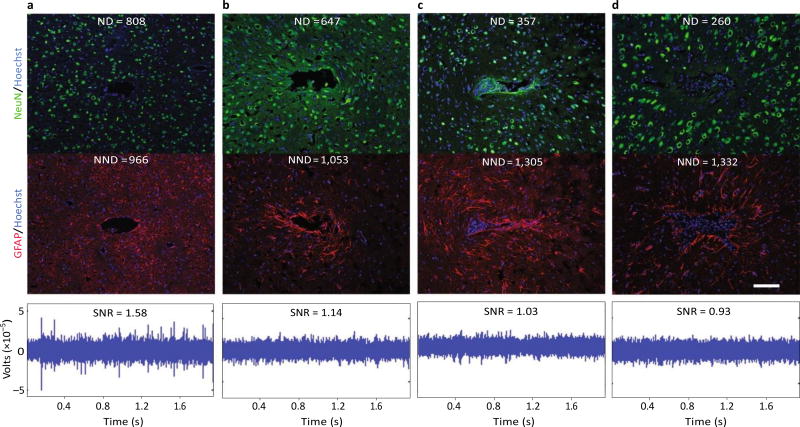
Fig.3.
Evidence for a negative impact of increased gliosis on recording quality. a–d, Representative images from four animals demonstrate the range of endpoint histological outcomes (from ‘good’ to ‘poor’, left to right). The figure has been generated after additional analysis on data collected in a previous study40. Neuronal nuclei (NeuN, green) and astrocytes (GFAP, red) surrounding probe tracts are shown, and the associated average neuronal and non- neuronal density data are listed (area binned cell counts, neuronal density (ND) and non-neuronal density (NND), in cells mm−2). Recording segments with signal-to-noise-ratio (SNR) values representative of the average value for each animal are depicted (the SNRs calculated from peak-to-peak noise result in lower values than those calculated from root-mean-square noise)40,221. Recording quality improved with decreased NND and increased ND/NND (P < 0.05, Spearman’s ρ, n = 6). Impedance increased with increased NND (P < 0.05, Spearman’s ρ, n = 6). Animals in a and c were drug-treated while b and d correspond to the controls. Scale bar, 100 µm. Figure adapted from ref.40, Elsevier.

