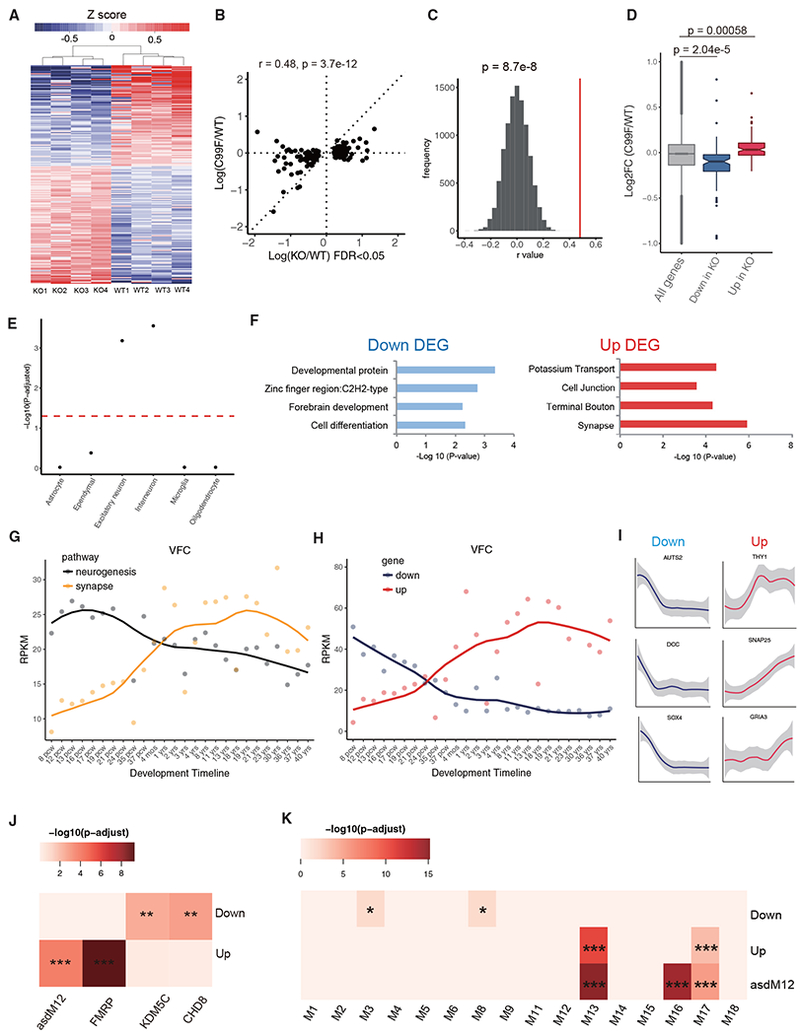
Figure 4. Transcriptional Alterations in the Cerebral Cortex in PHF6-Deficient Mice.

(A) Heatmap of 193 differentially expressed genes upon PHF6 KO by RNA-seq (edgeR, FDR <0.05).
(B) Correlation analysis of alteration of gene expression in the cerebral cortex of PHF6 C99F mice that were deregulated upon PHF6 KO (193 genes; FDR <0.05).
(C) Spearman correlation rho distribution by comparing gene expression changes in PHF6 KO and C99F mice, calculated by random sampling of 193 genes 10,000 times. Red line: rho = 0.48 (see B). Z score statistics; p = 8.7e-8.
(D) Boxplot of log fold change of upregulated and downregulated genes upon PHF6 KO in C99F. Wilcoxon rank sum test; p = 5.8e-4 (upregulated), p = 2.04e-5 (downregulated).
(E) Gene enrichment analysis of major brain cell types. Dotted red line: p-adjusted = 0.05.
(F) Gene Ontology analysis by DAVID for downregulated and upregulated genes upon PHF6 KO. DEG, differentially expressed gene.
(G) Average expression for neurogenic (GO: 0050769) and synaptic (GO: 0007268) genes across human brain developmental time in the VFC based on BrainSpan datasets.
(H) Average expression of downregulated and upregulated genes upon PHF6 KO across developmental time in the VFC based on BrainSpan datasets.
(I) Example of individual gene expression across development time.
(J) Enrichment analysis of upregulated and downregulated genes upon PHF6 KO with gene targets of FMRP, KDM5C, CHD8, and the autism module asdM12, containing misregulated genes in the frontal and temporal cerebral cortex in the brains of patients with autism spectrum disorder.
(K) Enrichment analysis of misregulated genes upon PHF6 KO and the asdM12 gene module with previously described developmental gene co-expression network modules.
Enrichment analysis was tested by hypergeometric test, followed by Benjamini-Hochberg multiple testing corrections. *p-adjusted < 0.05, **p-adjusted < 0.01, ***p-adjusted < 0.001. See also Figure S4.
