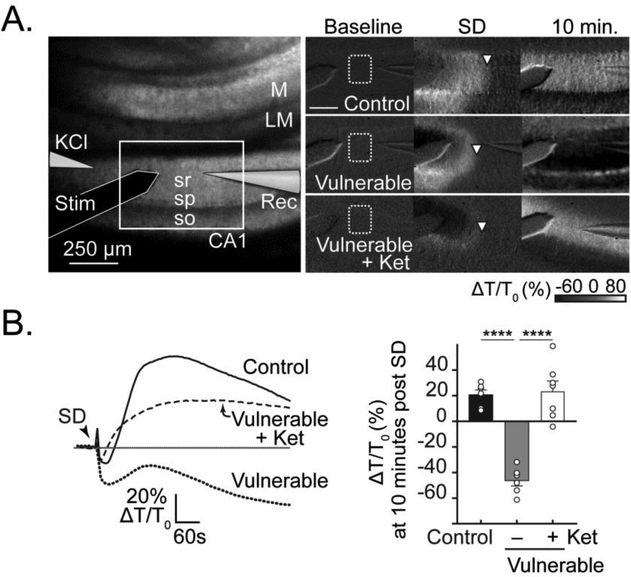
Figure 6. Ketamine protects against IOS decreases after SD in vulnerable slices.
A: Left hand panel shows the arrangement of recording electrodes on a transmitted light image. The white box outlines the imaging area shown in panels on the right; so, stratum oriens; sp, stratum pyramidale; sr, stratum radiatum; LM, stratum lacunosum moleculare; M, molecular layer of dentate gyrus. The set of images on the right show representative intrinsic optical (IOS, light transmittance) changes at baseline, during SD, and 10 minutes after SD in brain slices recorded under three different conditions: control, vulnerable, and vulnerable + ketamine. Note the difference in IOS seen at the 10-minute time point after SD. White arrowheads indicate the wave front of SD. Scale bar = 250 μm. B: Traces (left) show signals extracted from regions in stratum radiatum (dotted white box in A) during the three representative experiments shown in A. Summary data (n= 6–7, right hand panel) confirm substantially decreased light transmittance 10 minutes after the SD wavefront in vulnerable slices, and prevention by ketamine. ****P<0.0001

