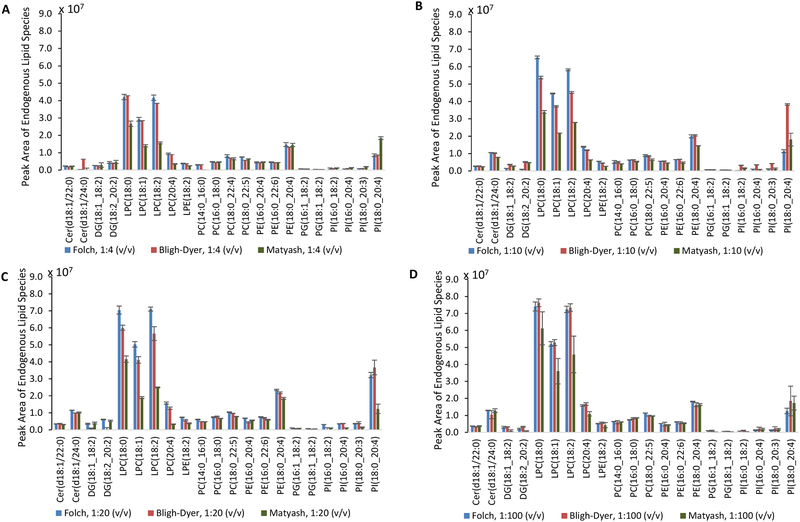
Fig. 1:
Comparison of endogenous lipid species extracted from SRM 1950 plasma with a 1:4 [A], 1:10 [B], 1:20 [C] and 1:100 [D] (v/v) sample-to-total solvent ratio. The (*) denotes a significant difference between the Bligh-Dyer and Matyash methods, (#) denotes a significant difference between the Folch and Matyash method, and (^) denotes a significant difference between the Bligh-Dyer and Folch method according to ANOVA with the Bonferroni correction, p-value < 0.05. Error bars represent the standard deviation of the mean.

