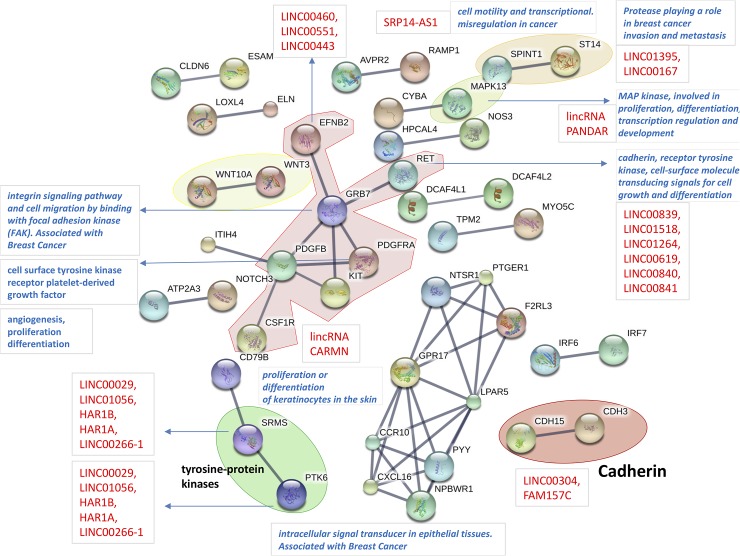
Fig 3. SKMEL-2 cell line map.
Protein-protein Interaction map from STRINGdb obtained from DiP (DEGs and differentially methylated). The effects of treatment were analyzed in hyper-methylated DEGs to consider silencing effects on expression before treatment. The red names refer to ncRNAs, and lincRNAs depend on 1Mb distance between their locus and the associated target genes.

