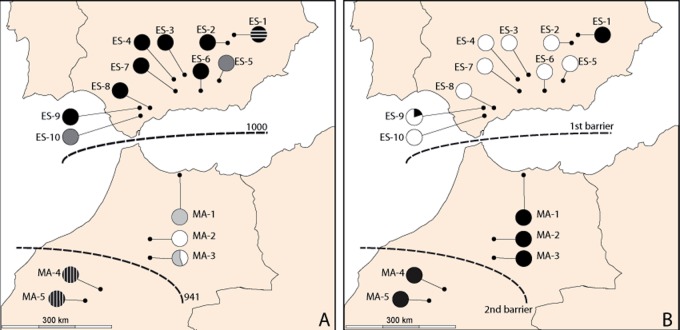
Fig 4. Geographical distribution of the best K value inferred by the software BAPS and barriers to gene flow.
(A) K = 6 for AFLP results. (B) K = 2 for plastid DNA dataset. Dotted lines represent the barriers to gene flow detected by the Barrier software. Barriers for AFLP data are based on 1000 bootstrapped FST matrices.

