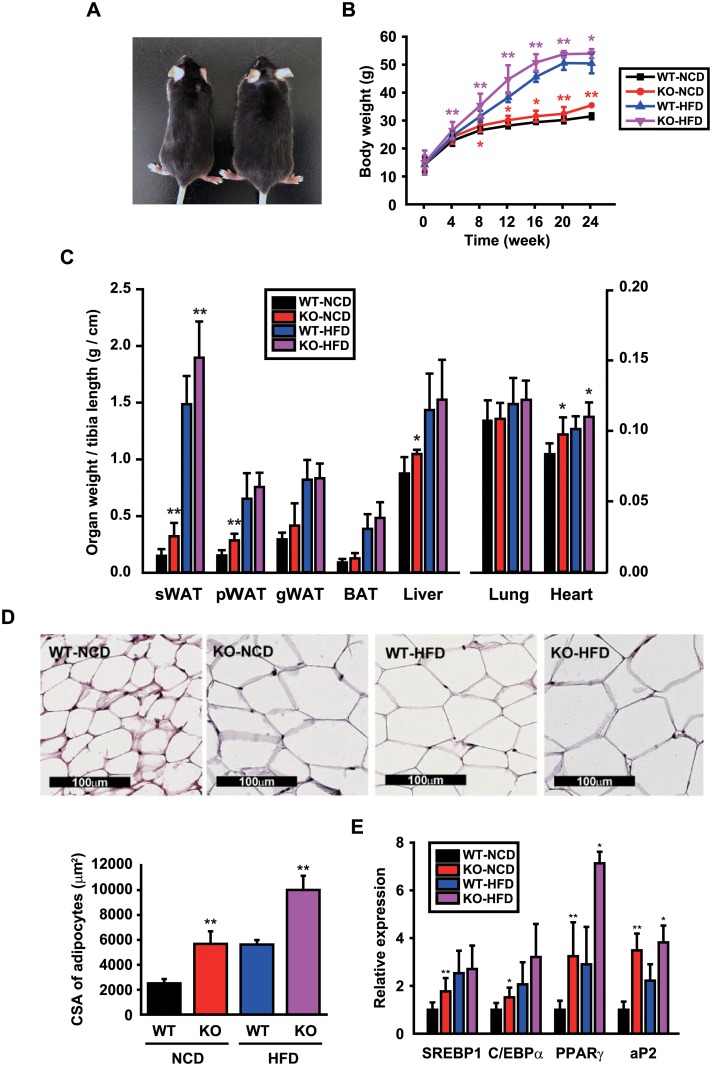
Fig 1. CCN5 KO mice exhibit mild obesity.
(A) A representative image of 24-week-old WT and CCN5 KO mice. (B) Body mass changes in each group during the 24 weeks of NCD or HFD feeding (mean data collected from 3 independent experimental sets, n = 6–12 per group for each experimental set). (C) Organ masses of WT and CCN5 KO mice after 24 weeks of NCD or HFD feeding (n = 7 for WT-NCD group, n = 6 for KO-NCD group, n = 14 for WT-HFD group, n = 16 for KO-HFD group). sWAT, subcutaneous white adipose tissue; pWAT, perirenal white adipose tissue; gWAT, gonadal white adipose tissue; iBAT, interscapular brown adipose tissue. (D) Representative H&E staining images of sWAT sections obtained from WT and CCN5 KO mice (upper panel). Mean cross-sectional areas of adipocytes (n = 3 per group) (lower panel). (E) The mRNA expression levels of adipogenic genes, sterol regulatory element-binding protein 1 (SREBP1), CCAAT/enhancer-binding protein α (C/EBPα), peroxisome proliferator activated receptor γ (PPARγ), and adipocyte protein 2 (aP2) (n = 4–6 per group). Data are presented as mean ± SD. *p<0.05, **p<0.01 vs. WT.

