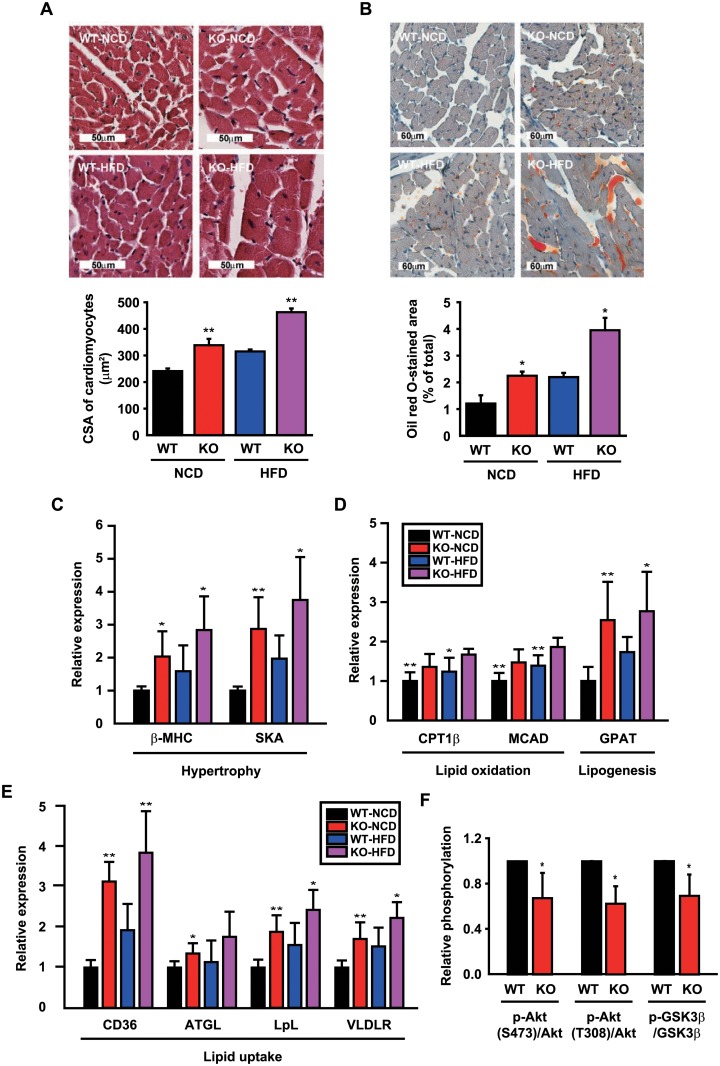
Fig 3. CCN5 KO exhibits lipotoxic cardiomyopathy.
(A) Representative images and quantitation of CSA of H&E-stained heart sections from WT and CCN5 KO mice after 24 weeks of NCD or HFD feeding (n = 4–7 per group). (B) Representative images and quantitation of the stained area of oil red O-stained heart sections from WT and CCN5 KO mice after 24 weeks of NCD or HFD feeding (n = 4 per group). (C-E) Relative mRNA expression levels of cardiac hypertrophy- and lipid metabolism-associated genes (n = 4–6 per group). (F) Relative phosphorylation levels of Akt and GSK3β in isolated cardiomyocytes treated with insulin (n = 4 per group). Original blot images are shown in S3 Fig. Data are presented as mean ± SD. *p<0.05, **p<0.01 vs. WT.

