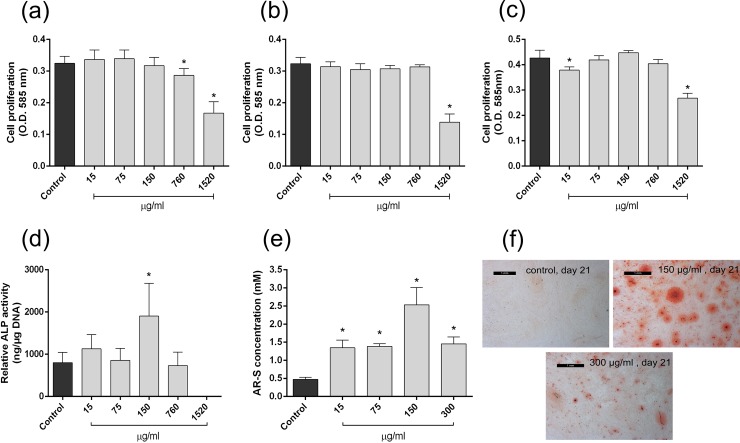
Fig 3. In vitro osteogenic effects of C. pallidum extract.
(a)-(c) Proliferation of MSCs at day 1 (a), 4 (b) and 7 (c) using crystal violet assay. Cell number is presented as mean +/- SD, (n = 4). (d) Differentiation of MSCs at day 14, presented as relative ALP activity, normalised to DNA content–mean +/- SD (n = 4). (e) In vitro mineralisation of MSCs at day 21. AR-S concentration is presented as mean +/- SD (n = 4). (f) Micrographs of MSC monolayers stained with AR-S, for control day 21 and C. pallidum at a 150 and 300 μg/ml concentration (black rectangle is a 1 mm scale for each micrograph). * indicates a statistically significant difference (p<0.05) compared to the relevant control.

