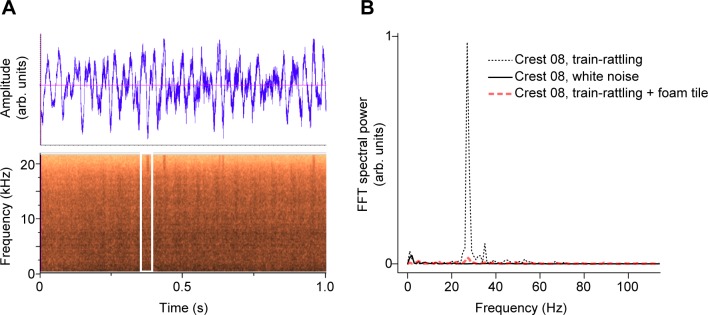
Fig 5. Effect of audio playback on crests.
(A) An example waveform and spectrogram of the train-rattling sound used in the playback experiment. The white box in (B) highlights a single rattle note in the train-rattling spectrogram. (B) Vibrational response of a peahen crest (Crest 08) exposed to audio playback in the near-field of the speaker. The FFT spectral power during playback of train-rattling sound (dotted line, plotted on a linear scale on the y-axis) has a peak near the resonant frequency of the crest. The spectral power values recorded during white noise playback (solid line) and when the train-rattling audio was blocked by a foam tile (red dashed line) are also shown.

