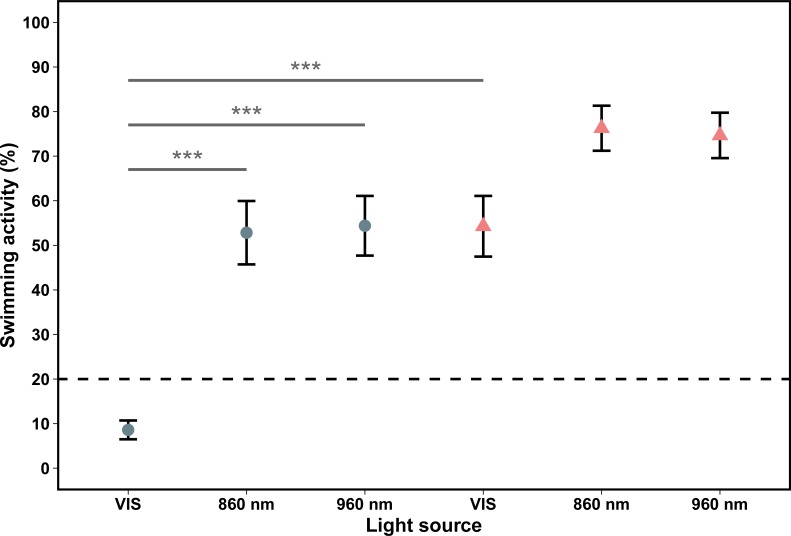
Fig 2. Swimming activity [%] of 96 hpf (blue circles) and 120 hpf (red triangles) zebrafish larvae under different light sources.
The x-axis indicates the three tested light sources and the y-axis shows the swimming activity (%) of the zebrafish larvae. Shown are mean ± standard error. Sample size in each experiment: N = 30. ***P < 0.001. (VIS = visible light (blue-white-light, 440–700 nm, 860 nm = NIR light with peak illumination at 860 nm; 960 nm = NIR light with peak illumination at 960 nm).

