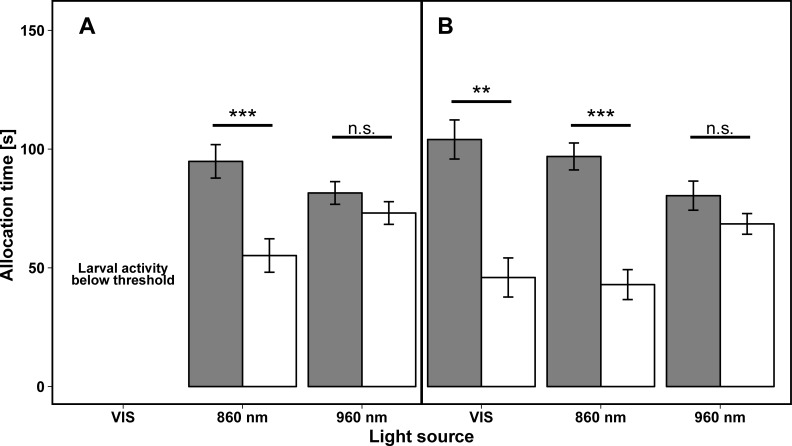
Fig 3. Mean allocation time [s] of both larval stages of zebrafish larvae under different light conditions.
Bars present mean allocation time [s] ± standard error (which sum up to 150 s) of zebrafish larvae (A: 96 hpf, B: 120 hpf) in halves of vessels illuminated with NIR light (white bars) and radiated by the thermal control (dark grey bars) (N96hpf/VIS = 3, N96hpf/860 nm = 20, N96hpf/960 nm = 22, N120hpf /VIS = 20, N120hpf /860 nm = 28, N120hpf /960 nm = 28). The x-axis represents the wavelengths of the three different used light sources (VIS (440–700 nm), 860 nm; 960 nm) and asterisks indicate significant differences compared to thermal control (**P < 0.01, ***P < 0.001, n.s. = not significant).

