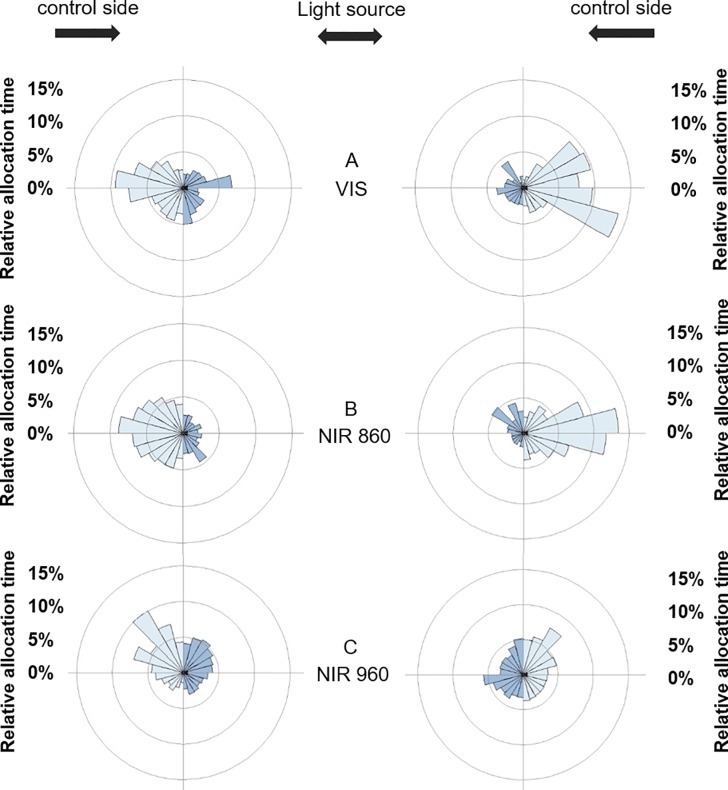
Fig 5. Sector diagram of allocation preference for 120 hpf zebrafish.
The blue bars represent the mean allocation time [%] of zebrafish larvae in the test vessel under VIS light (A), NIR light at 860 nm (B) and under NIR light at 960 nm (C). The diagram is divided into 24 sectors, whereby each sector illustrates 15° (Left side: N120hpf/VIS = 10, N120hpf/860 nm = 15, N120hpf/960 nm = 15; Right side: N120hpf/VIS = 10, N120hpf/860 nm = 13, N120hpf/960 nm = 13; except larvae below 20% activity threshold).

