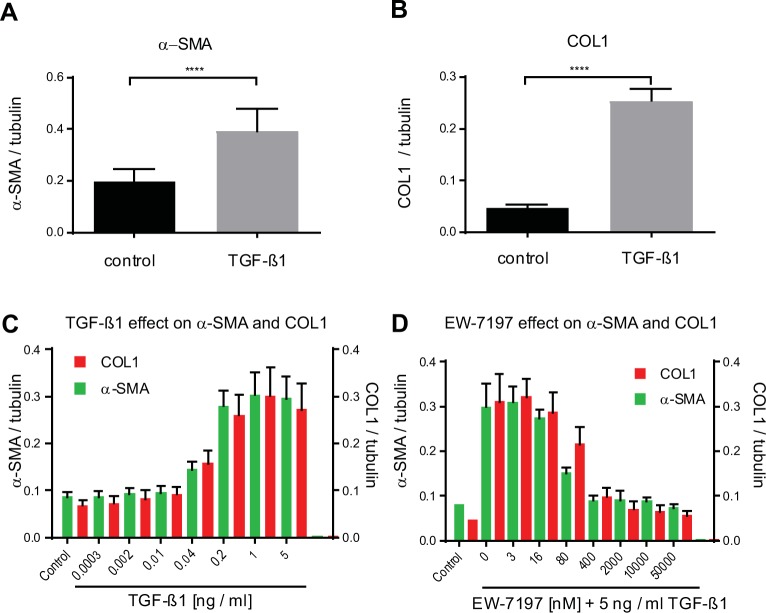
Fig 3. High–throughput–MS / MS quantification of α–SMA, COL1 and tubulin in lysate of NHLF cells.
NHLF cells were stimulated with 5 ng / ml TGF–β1 and lysed after 24 h. (A) α–SMA and (B) COL1 were quantified by MS / MS and normalized to tubulin. Data are means and bars show SD of control (black) and TGF–β1–treated (grey) replicates (n = 16). A two–tailed unpaired t test comparing control to TGF–β1–treated is given; **** p < 0.0001. (C) NHLF cells stimulated with increasing concentrations of TGF–β1 were lysed after 48 h and α–SMA, COL1, and tubulin (used for normalization), were quantified from single–wells by MS / MS. (D) NHLF cells were incubated at t = 0 h with dilution series of the ALK5–blocker EW–7197 (0–50,000 nM) and then stimulated with 5 ng / ml TGF–β1 or not (control). Cells were lysed 48 h after TGF–β1 addition and α–SMA and COL1 were quantified. 0.2% DMSO solvent was present in all wells. All analytes were normalized to tubulin. Bars show mean ± SD, n = 8.

