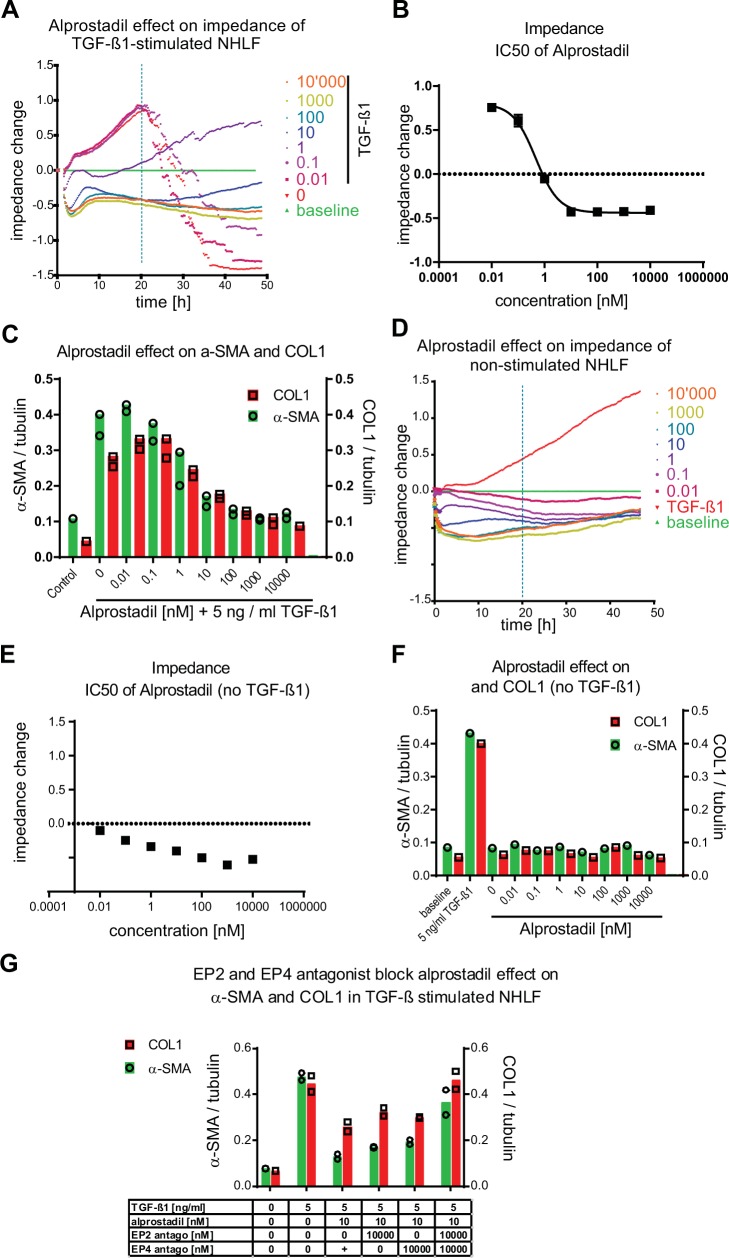
Fig 4. Alprostadil inhibits TGF–β1–induced changes in NHLF by activating both, the EP2 and the EP4 receptor,without affecting baseline α–SMA and COL1 levels in non–stimulated NHLF.
NHLF fibroblasts were incubated with dilution series of alprostadil (0.01–10,000 nM) at t = 0 h and then stimulated (A–C) or not (D–F) with TGF–β1 (5 ng / ml). Non–stimulated NHLF cells (0 ng / ml TGF–β1, 0 nM alprostadil, baseline) and 5 ng / ml TGF–β1–treated (0 nM alprostadil; vehicle) are depicted in green and red, respectively (A, D). Concentration response curves of alprostadil in presence (B) and absence (E) of 5 ng / ml TGF–β1 where then generated with baseline subtracted impedance values at t = 20 h post TGF–β1 addition. (G) At t = 0 h NHLF fibroblasts were incubated with 10,000 nM of the EP2 prostaglandin receptor antagonist, the EP4 receptor antagonist, and of both the EP2 and the EP4 receptor antagonists in the absence or in presence of 10 nM alprostadil and 5 ng / ml TGF–β1. At t = 48 h after TGF–β1 (C, G) or vehicle (F) addition the cells were lysed and α–SMA and COL1 were quantified by MS / MS. Bars represent protein data normalized to tubulin. Number of sample (n = 1) is shown in each figure A, D, E, F. Bars represent mean of n = 2 samples in B, C and G.

