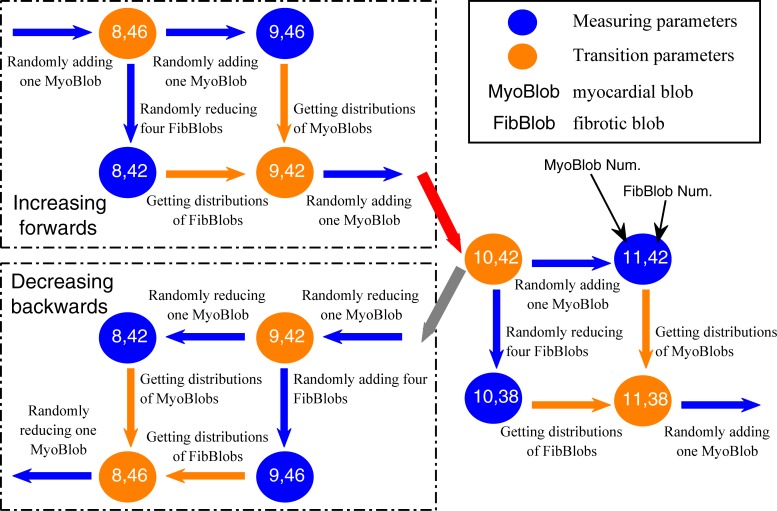
Fig 2. Flow chart of the proposed interrelated method on an isolation layer and its adjacent fibrotic layer.
Blue arrows denote the changes of fibrotic blobs or myocardial blobs, and orange arrows denote the same distributions of fibrotic blobs or myocardial blobs. The red arrow denotes the use of the forward box, and the gray arrow denotes the use of the backward box. The measuring parameters are used to produce a series of interrelated simulations.

