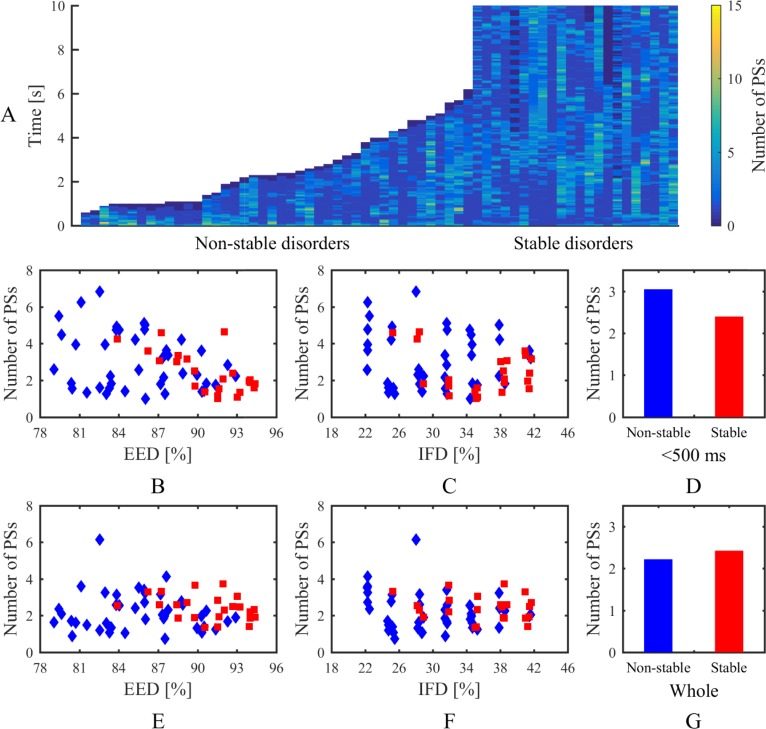
Fig 11. Number of phase singularities at each 1 ms in the stochastic group.
(A) PS number map in non-stable and stable disorders. Average number of phase singularities during the first 500 ms for each simulation related to (B) endo-epicardial dissociation and (C) intramural fibrosis. (D) Average number of phase singularities during the first 500 ms for all simulations in non-stable and stable disorders. Average number of phase singularities during the whole time for each simulation related to (E) endo-epicardial dissociation and (F) intramural fibrosis. (G) Average number of phase singularities during the whole time for all simulations in non-stable and stable disorders. Red squares denote stable disorders. Blue diamonds denote non-stable disorders. IFD is the intramural fibrosis degree and EDD is the endo-epicardial dissociation degree.

