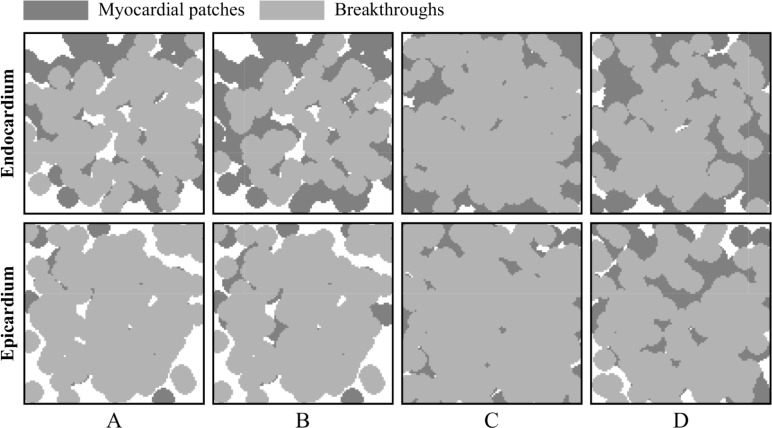
Fig 14. Location distributions of breakthroughs in the stochastic group.
The results are extracted from (A) 23 stable simulations during the whole duration, (B) 23 stable simulations during the first 3 seconds, (C) 42 non-stable simulations, and (D) 27 non-stable simulations with the duration less than 3 seconds.

