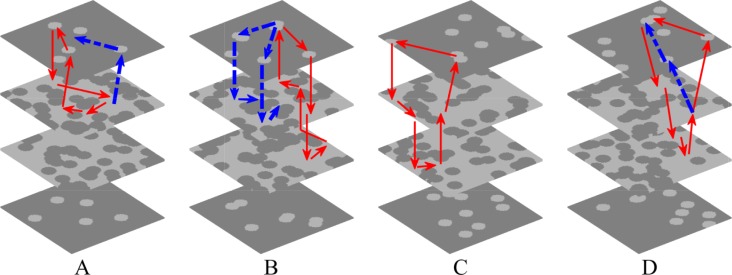
Fig 15. The intramural re-entry circuits of four stable simulations.
The number of myocardial blobs in each layer and the number of fibrotic blobs in each layer are (A) 5, 50, (B) 7, 50, (C) 9, 42, and (D) 9, 46. Red arrows denote the loop lines of intramural re-entries, and blue arrows denote other possible conduction pathways.

