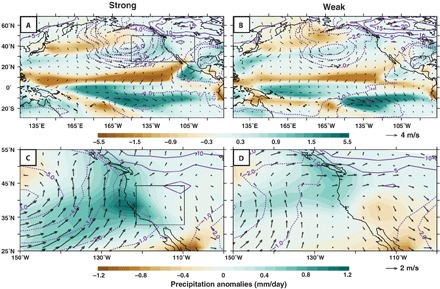
Fig. 2. North Pacific precipitation and atmospheric circulation anomalies in hosing experiments.

(A) Anomalies in the DJF precipitation (in mm/day; shading), near-surface (10 m) wind (in m/s; vectors), and sea-level pressure (in Pa; purple contours) for the Strong hosing experiment with respect to its control. The black box shows the area plotted in (C) and (D). (B) As in (A), but for the Weak simulation. (C and D) Insets showing anomalies over the eastern Pacific and western United States for the Strong (C) and Weak (D) simulations. Note that the shading color scale is changed between the top and bottom panels. Black box in (C) shows the area of the map in Fig. 1A.
