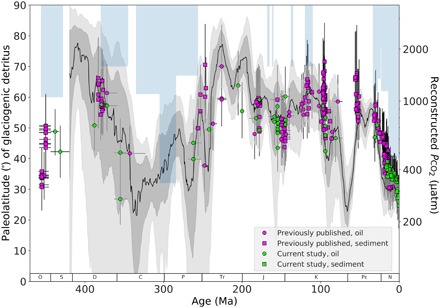
Fig. 3. Phanerozoic Pco2 from phytane.

Estimated Phanerozoic Pco2 (on a log scale) from literature (pink) and data from this study (blue), and from sediment (square) and oil (circle). Horizontal error bars indicate uncertainty in age. Vertical error bars indicate 1 SD (68%) uncertainty in Pco2 estimation based on Monte Carlo simulations, culminating the uncertainty in b (±60‰ kg μM−1 SD), Ɛf (±1.5‰ uniform distribution), and Ɛp (combined uncertainty in δ13C of phytane ± 0.5‰ uniform distribution, the offset between biomass and phytane ± 1.3‰ SD, δ13C of planktonic foraminifera ± 0.4‰ uniform distribution, and SST ± 4°C SD). Plotted for comparison, the Foster et al. compilation shows the Monte Carlo resampling and LOESS fit of ca. 1500 data points from the five most robust Pco2 proxies: δ13C of long-chain alkenones, δ11B of marine carbonate, δ13C of paleosols, stomatal densities and indices in plants, and δ13C of liverworts. Sixty-eight percent and 95% confidence intervals are shown in gray and light gray, respectively. The light blue bars represent glacial paleolatitude, as determined by the literature compilation of glaciogenic detritus (46).
