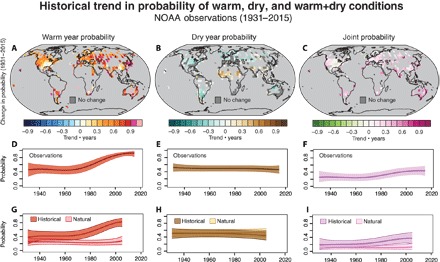
Fig. 1. Historical changes in warm year probability, dry year probability and joint probability.

(A to C) Change in warm year probability, dry year probability, and joint probability, calculated as the trend over the period (1931–2015) using Sen’s slope estimator times the length of the period. Maps show results for the 50th percentile of the Bayesian sampling. Dark gray indicates no change in the location parameter through time (see Materials and Methods). (D to F) Global average of the warm year probability, dry year probability, and joint probability aggregated across the grid points in the National Oceanic and Atmospheric Administration (NOAA) observations. The bold line shows the posterior mean, and the color envelope shows the 2.5th to 97.5th percentile range (see Materials and Methods). (G to I) Global average of the warm year probability, dry year probability, and joint probability aggregated across the grid points in the Historical and Natural forcing experiments of the CMIP5 global climate model ensemble. The bold line shows the ensemble-mean posterior mean, and the color envelope shows the ensemble-mean 2.5th to 97.5th percentile range (see Materials and Methods).
