
Fig. 2. Historical changes in joint probability of years that are both warm and dry occurring simultaneously in different regions of the world.
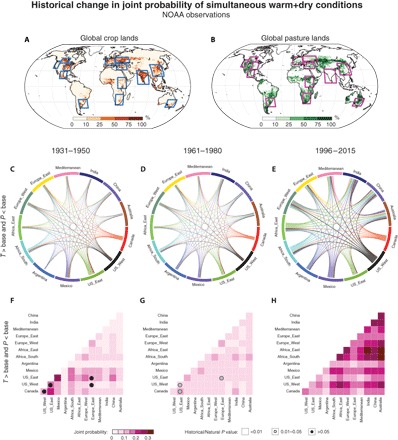
(A and B) Maps showing global cropland and pasture areas in the year 2000 [redrawn from (32)], along with the regions used in our analysis. (C to E) Thickness of lines shows the probability (based on the Bayesian posterior mean) that both regions of a respective region-region pair experience simultaneous warm and dry conditions in the same year during the 1931–1950, 1961–1980, and 1996–2015 periods, based on NOAA observations. Each region pair shares a single joint probability. The color of each region-region joint probability is shown as the color of the first region on the circular plot, starting with Canada and moving clockwise around the circular plot. Thus, all region-region joint probabilities involving Canada are shown in red, and all involving US_West are shown in dark gray except for Canada-US_West, etc. The values of the region-region joint probabilities are shown in (F) to (H). (F to H) Colors show the probability values depicted by lines in (C) to (E). Symbols show the P value of the difference in joint probability between the CMIP5 Historical and Natural simulations for the 1931–1950, 1961–1980, and 1986–2005 periods (see Materials and Methods). The absence of a symbol indicates P value less than 0.01, a gray circle indicates P value between 0.01 and 0.05, and a black circle indicates P value greater than 0.05.