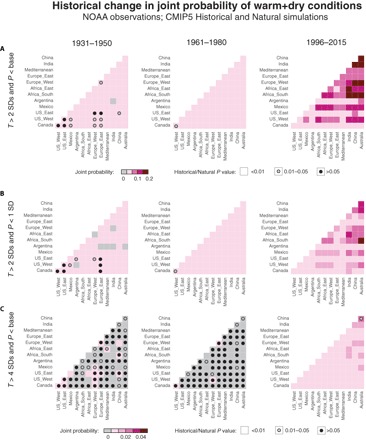
Fig. 3. Historical change in joint probability of simultaneous warm+dry conditions of varying severity.

Colors show the probability (based on the Bayesian posterior mean) that both regions of a respective region-region pair experience simultaneous warm and dry conditions in the same year during the 1931–1950, 1961–1980, and 1996–2015 periods, based on NOAA observations. (A) Joint probability for years in which the temperature anomaly is at least 2 SDs warmer than the baseline mean and the precipitation anomaly is drier than the baseline mean. (B) Joint probability for years in which the temperature anomaly is at least 2 SDs warmer than the baseline mean and the precipitation anomaly is at least 1 SD drier than the baseline mean. (C) Joint probability for years in which the temperature anomaly is at least 4 SDs warmer than the baseline mean and the precipitation anomaly is drier than the baseline mean. The P value of the difference in joint probability between the CMIP5 Historical and Natural simulations is indicated as in Fig. 2.
