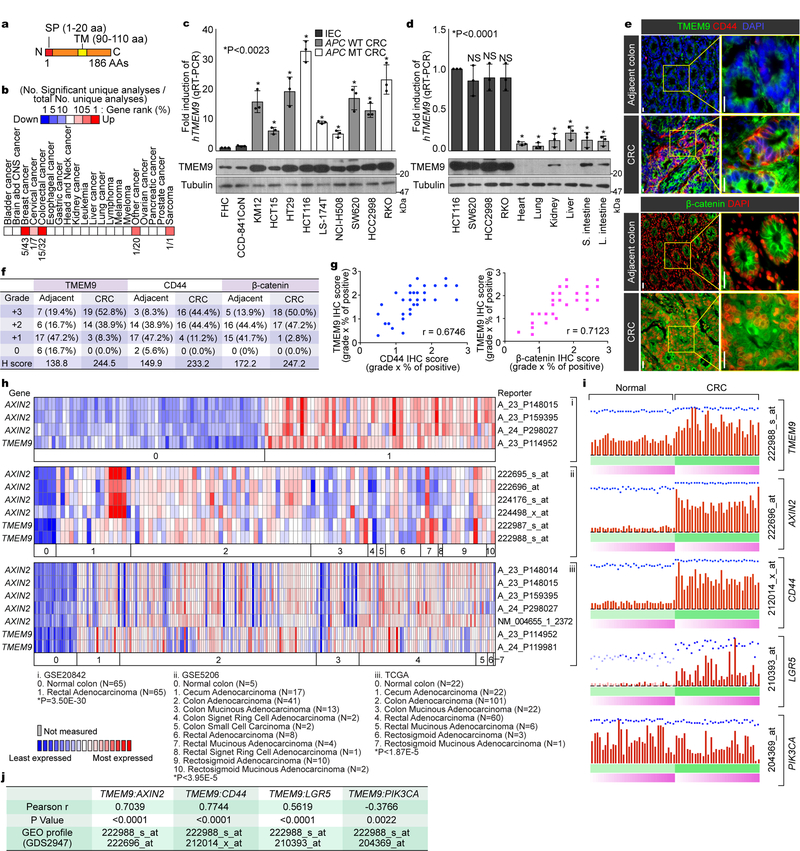
Fig. 1. Expression of TMEM9 in CRC cells.
a, Illustration of the TMEM9 domains. b, In silico analysis of TMEM9 expression in CRC. Oncomine analysis of TMEM9 expression in human cancers (www.oncomine.org). 10% gene rank; p-value<0.0001; fold change>2; compared with normal cells. c, High expression of TMEM9 in CRC. Two IECs and nine CRC cells were collected for IB and qRT-PCR. Tubulin served as a loading control, and TMEM9 expression was normalized by HPRT1. n=3 independent experiments.d, Expression of TMEM9 in mouse tissues. Protein and mRNAs were extracted from six mouse tissues and assessed by IB and qRT-PCR. CRC cells were served as a positive control. n=3 independent experiments e-g, Expression of TMEM29, CD44, and β-catenin in CRC TMA. IHC of TMEM9, CD44, and β-catenin was performed using TMA (Biomax, BC05023; e). H score (f) and Pearson’s correlations (g) were calculated. n=36 biologically independent samples.h, Co-expression of TMEM9 with AXIN2. Oncomine analysis of GSE20842, GSE5206, and TCGA data sets; 10% gene rank; P value<0.0001; fold change>2; compared with normal cells.i and j, Co-expression of TMEM9 with Wnt/β-catenin target genes. GEO data sets (GDS2947) were analyzed for each gene expression in normal intestine and the matched CRC samples (32 patient samples; i). Pearson’s correlations were determined (j).Scale bars=20μm; NS: Not significant. Error bars: mean ± S.D.; Two-sided unpaired t-test.

