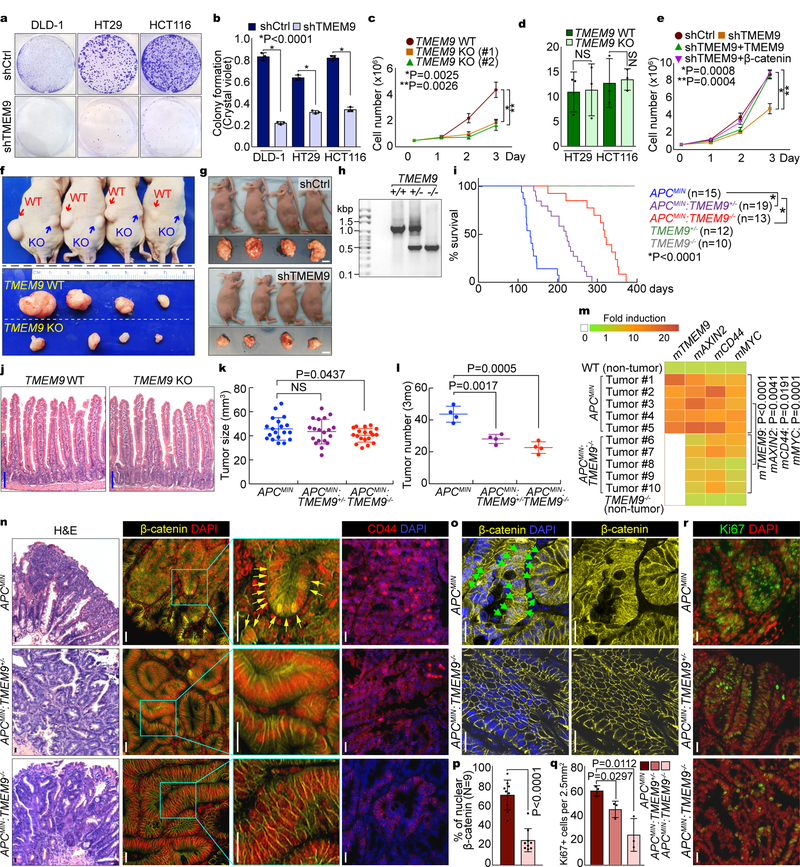
Fig. 6. Suppression of intestinal tumorigenesis by blockade of TMEM9.
a-c, Decreased CRC cell proliferation by TMEM9 depletion. Crystal violet staining (a) was quantified by absorbance at 590nm (b). HCT116 cell proliferation was analyzed by cell counting (c). Two different gRNAs (#1 and #2) were used for CRISPR/Cas9 targeting of TMEM9 alleles. d, No effects of TMEM9 KO on cell death. Trypan blue positive cells were quantified. e, Rescue of TMEM9 depletion-induced cell growth inhibition by TMEM9 or β-catenin. HCT116 (shCtrl and shTMEM9) cells were stably transduced with TMEM9 or β-catenin and analyzed by cell counting. f and g, Reduced CRC cell proliferation by TMEM9 depletion ex vivo. Each mouse (n=4 biologically independent samples) was subcutaneously injected with 1×10⁷ cells into the left (HT29 [Ctrl]) and the right flanks (TMEM9 KO-HT29; f). 15 days after transplantation, tumors were harvested. HCT116 (shCtrl and shTMEM9) cells were subcutaneously injected into immunocompromised mice (g). Scale bars=1cm. Experiments were performed once. h, PCR genotyping results of TMEM9 KO. i, Survival curves (Kaplan-Meier analysis) of APCMIN, APCMIN:TMEM9+/−, and APCMIN:TMEM9−/− mice. j, No defects in IEC differentiation by TMEM9 KO. H&E (Hematoxylin & Eosin). Scale bars=100μm. k and l, Decreased tumor growth by TMEM9 KO. Tumor size (k; n=19 independent samples) and tumor number (l; n=4 biologically independent samples) were quantified by measuring intestinal adenomas in APCMIN, APCMIN:TMEM9+/−, and APCMIN:TMEM9−/− mice (3mo of age). Experiments were performed once. m, Downregulation of Wnt/β-catenin target genes by TMEM9 KO in APCMIN adenomas. APCMIN- and APCMIN:TMEM9 KO-induced tumors and IECs of WT and TMEM9 KO were collected for qRT-PCR of β-catenin target genes (AXIN2, CD44, and MYC) and TMEM9. n, IHC analysis of intestinal tumors from APCMIN, APCMIN:TMEM9+/−, and APCMIN:TMEM9−/− mice. Scale bars=20μm. o and p, Loss of nuclear β-catenin by TMEM9 KO in APCMIN mice. APCMIN- and APCMIN:TMEM9 KO-induced tumors were stained with β-catenin antibody (o) and quantified (n=9 independent tumors; p). Scale bars=20μm. q and r, IHC for Ki67 (r) and quantification of Ki67 positive (Ki67+) cells from intestinal tumors (q; n=3 independent tumors). Scale bars=20μm. Representative images and blots of three experiments with similar results (panels a-e, j, and m-r); Error bars: mean ± S.D. Two-sided unpaired t-test. NS: Not significant.

