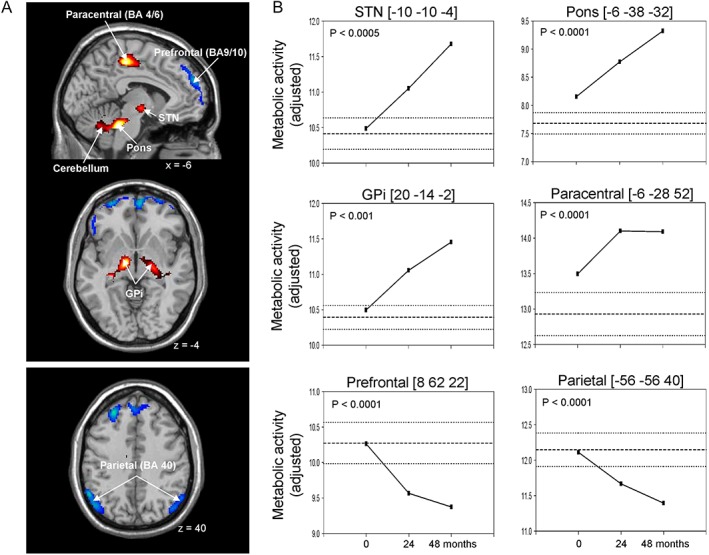
Figure 2.

(A) Voxel‐based analysis of longitudinal changes in regional metabolic activity. Metabolic increases with disease progression are displayed using a warm colors. Progressive metabolic declines are displayed using a cold colors. (B) metabolic data at each timepoint. The coordinates refer to the Montreal Neurological Institute (MNI) standard space. GPi, internal globus pallidus; STN, subthalamic nucleus; BA, Brodmann area. Figure reprinted with permission from Huang C, Tang C, Feigin A, et al. Changes in network activity with the progression of Parkinson's disease. Brain 2007;130(7):1834‐1846.120
