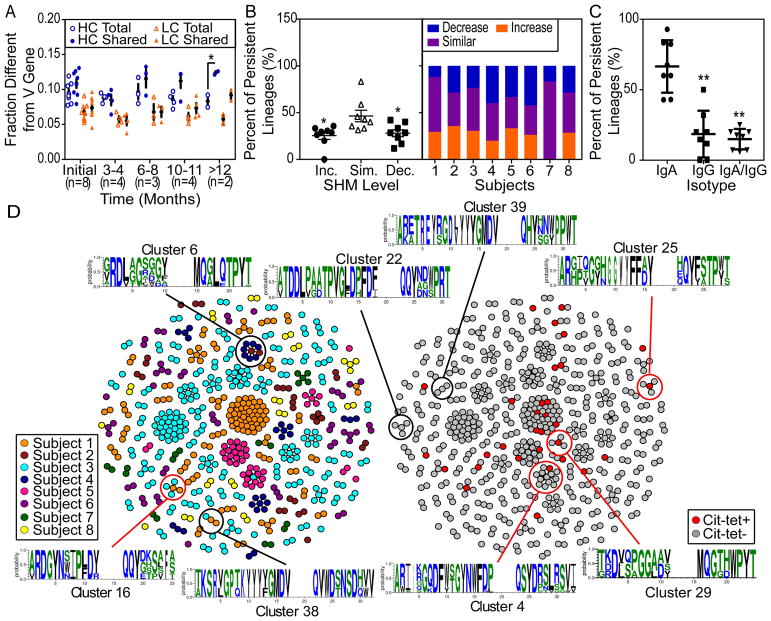
Figure 2.
A subset of the persistent lineages increase in SHMs over time, and persistent lineages predominantly express the IgA isotype. A, Sequences from eight anti-CCP+ RA subjects were analyzed for differences in SHM levels among all consensus, IMGT-aligned sequences (Total) compared to the persistent lineage-derived subset (Shared). * = P < 0.05 by two-way ANOVA, Tukey correction. B, Persistent lineages were evaluated for SHM levels and categorized according to average SHM level over time: increasing (Inc.), maintaining similar levels (Sim.), or decreasing (Dec.). * = P < 0.05 by one-way ANOVA, Tukey correction. C, For IgA/IgG-expressing plasmablasts, the percent of persistent lineages consistently expressing IgA was compared to that utilizing IgG or both IgG and IgA. ** = P < 0.01 by one-way ANOVA, Tukey correction. In panels A–C, dots represent individuals and bars indicate mean ± SEM. D, Persistent lineage-derived sequences were evaluated for similarities in CDR3 regions, and clusters visualized by igraph. Each dot represents the sequence from a single cell. Dots are colored by subject (left) or by citrullinated-peptide tetramer staining (right). Clusters with ≥1 member binding to citrullinated-peptide tetramers are circled in red. Motifs of clusters comprised of ≥1 subject were visualized (WebLogo3.5.0).

