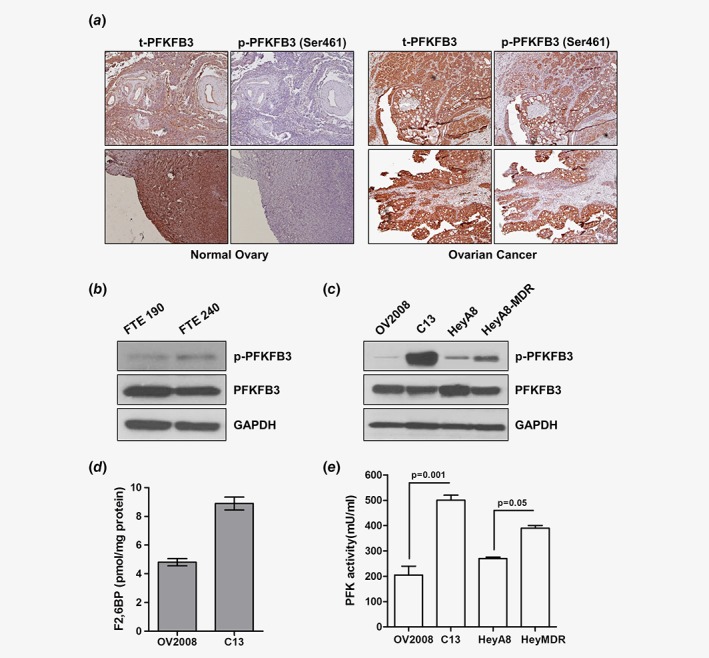
Figure 1.

Ovarian tumors and cells express high PFKFB3 activity. (a) Representative images of immunohistochemical staining of phospho (p)‐PFKFB3 (ser461) and total (t)‐PFKFB3 performed in ovarian tumor tissue and normal ovary. p‐PFKFB3 showed tumor‐specific expression. Immunoblot analysis of p‐PFKFB3 and t‐PFKFB3 in FTE (fallopian tube epithelial) cells (b) and in OV2008, C13, HeyA8 and HeyA8MDR cells (c) showed that the resistant cell lines have higher levels of p‐PFKFB3. (d) F2,6BP assay performed in OV2008 and C13 cells as described in the methods section. (e) Total PFK activity in OV2008, C13, HeyA8 and HeyA8MDR cells were determined with PFK activity assay. All experiments were repeated at least three times. Data are shown as mean ± SD of 3 replicates per cell line. *p < 0.05; **p < 0.01. [Color figure can be viewed at wileyonlinelibrary.com]
