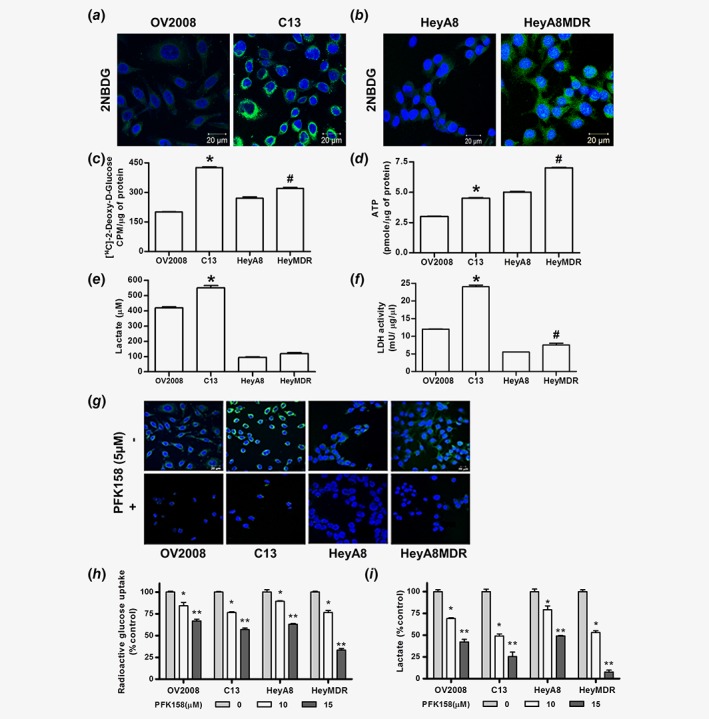
Figure 2.

Chemoresistant cells manifest increased glucose uptake, lactate release, intracellular ATP and LDH activity which is inhibited by PFK158 treatment. Fluorescence images of glucose uptake using 2‐NBDG in OV2008 and C13 (a), HeyA8 and HeyA8MDR (b) cells. Glucose uptake using [1‐14C] 2‐deoxy‐d‐glucose (c), intracellular ATP (d), lactate release (e) and LDH activity (f) were measured in OV2008, C13, HeyA8 and HeyA8MDR cells, where *p < 0.01 and #p < 0.05. Glucose uptake using 2‐NBDG dye (g), 14C‐2‐DG glucose (h) and lactate release (i) in the presence and absence of PFK158 in OV2008, C13, HeyA8 and HeyA8MDR cells. All experiments were repeated at least three times. Data are shown as mean ± SD for 3 replicates per cell line. *p < 0.05; **p < 0.01. [Color figure can be viewed at wileyonlinelibrary.com]
