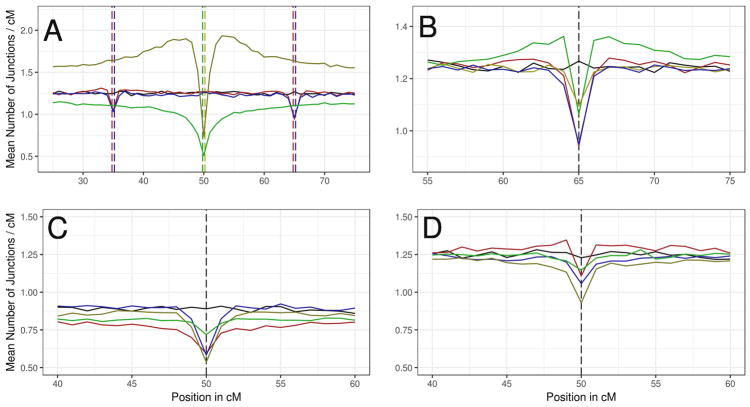
Figure 6.
The effect of genetic architecture of reproductive isolation on junction density. Mean junction densities across 1000 simulations in 1 cM windows are plotted against their genetic positions on an autosome. In all graphs, the solid black line represents the junction density in the neutral demographic model (d=500, m=0.1). Vertical dashed lines indicate the positions of loci under selection. Colors match their corresponding mean junction densities and black dotted lines are used when loci are at the same location for all experiments plotted. (A) Comparison of single-locus selection to epistatic (BDMI) selection. Yellow = single-locus positive selection with s=0.1 (additive); green = single-locus underdominant selection with s=0.1; red = epistatic selection against DD BDMI with s=0.5; blue = epistatic selection against DD BDMI with s=0.1. (B) Comparison of different modes of dominance among BDMIs with s=0.5. Red = DD, yellow = RR, green = DR, and blue = AN. (C and D) Comparison between signatures on the X chromosome (C) and the Autosome (D) for unlinked X-autosome BDMI pairs (with each locus shown in its non-native deme). Yellow line = DD BDMI; green line = RR BDMI; red line = dominant X-linked allele and recessive autosomal allele; blue line = recessive X-linked allele and dominant autosomal allele.

