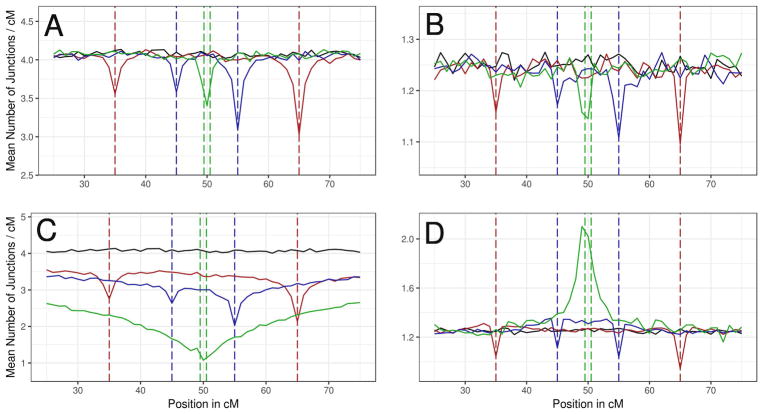
Figure 7.
Combined effects of linkage, dominance, and migration rate on BDMI ancestry junction signatures. Mean junction densities from 1000 simulations in 1 cM windows are plotted against their genetic positions on an autosome. In all graphs, the solid black line represents junction density in a neutral demographic model with a deme size of 500 at 1500 generations. Colored lines represent simulations with linked BDMIs spaced at different intervals: Red = 30 cM; blue = 10 cM; green = 1 cM. Vertical dashed lines indicate the positions of loci under selection with corresponding colors: red = BDMI loci spaced at 30 cM; blue = 10 cM; green = 1 cM; black = neutral model with d=500; all at 1500 generations. (A) RR BDMI, m=0.01. (B) RR BDMI, m=0.1. (C) DD BDMI m=0.01. (D) DD BDMI, m=0.1.

