Figure 8.

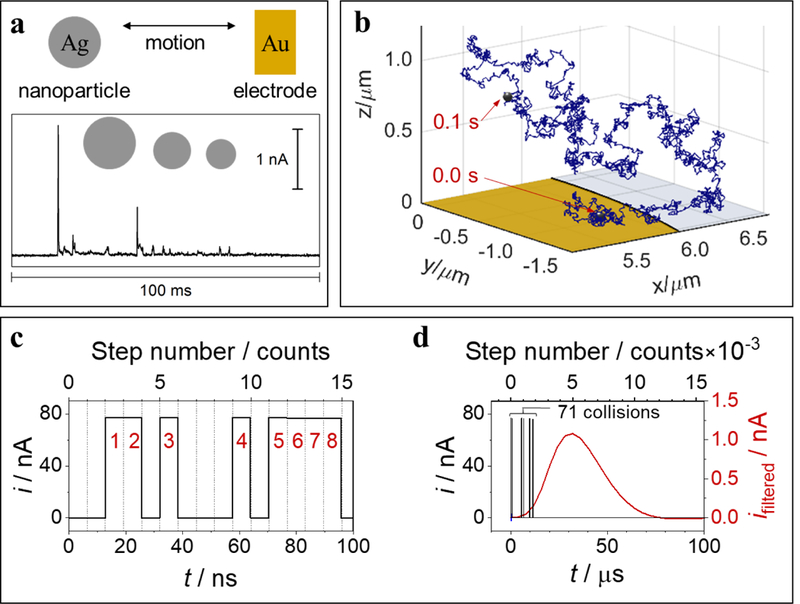
Experimental and simulated results for partial oxidations of an individual Ag nanoparticle, 35 nm radius. (a) Current vs time (i-t) trace (bottom) resulting from multiple partial oxidation/collision events at a Au microelectrode, 6.25 μm radius, held at 600 mV vs Ag/AgCl wire (1.1 V vs SHE), acquired with 3-pole low-pass Bessel filter (10 kHz cutoff) and 50 kHz sampling rate, electrolyte: 20 mM potassium nitrate and 8 mM trisodium citrate. (b) Simulated 3-D motion trajectory over a 0.1 s time interval, starting (0 ms) and ending (100 ms) positions in trajectory trace as labelled. Au electrode (yellow) and glass sheath (light gray) drawn to scale. (c) Results of electrochemical random-walk simulation for a Ag nanoparticle, 35 nm radius, showing resulting i-t traces for ideal unfiltered current (black) over the first 100 ns of electrode-nanoparticle collisions/oxidations, cumulative collision count shown in red numeric labels. (d) Results from same simulation in part (c) shown over longer (0.1 ms) timescale with simulated filtered current (3-pole low-pass Bessel, 10 kHz cutoff frequency, 250 kHz sampling rate) shown in red (right vertical axis). Number of discrete simulated motion steps included in top horizontal axes for parts (c) and (d). Adapted from references 77 and 78.
