Figure 4.
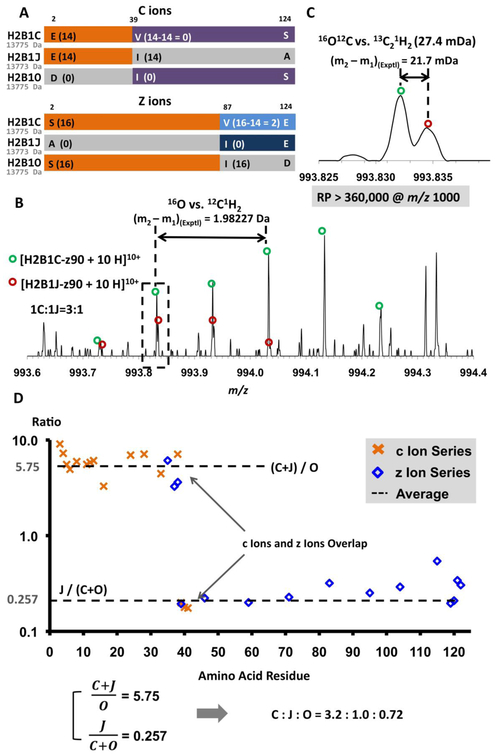
A) Sequences and putative ECD fragments for H2B1C, H2B1J, and H2B1O. Because of very small mass differences (~2 Da), these species will be isolated and fragmented together. Segments in orange or purple represent regions for which ECD fragments are identical in mass for 2 proteoforms. These three species yield unique fragments (segments in light blue, dark blue, and gray) only in the region z87-z124.
B) Mass spectral segment for the z90 10+ ions of H2B1C and H2B1J to show the resolving power required for performing reliable top-down ECD MS/MS. The mass difference between H2B1C-z90 and H2B1J-z90 is the difference between 16O and 12C1H2 (1.97926 Da) and the split at m/z 993.83 is due to the small mass difference between 16O12C2and 13C212C1H2 (27.4 mDa). Note that the minimum required resolving power at m/z 1,000 is 360,000.
C) Mass scale-expanded segment, showing the narrow split at m/z 993.83 between 16O12C2 and 13C212C1H2 (27.4 mDa).
CD) Abundance ratio for the c ions (orange crosses) or z ions (blue squares) generated from H2B1C, H2B1J, or H2B1O for the m/z 811 precursor from HeLa cells. The ratio for the c-ion and z-ion series spanning AA1 to AA38 represents the ratio between the sum of H2B1C and H2B1J to H2B1O, whereas those in the range of AA39 to AA125 reflect the ratio between H2B1J and the sum of H2B1C and H2B1O. From the expressions at bottom left, the relative abundances of H2B1C, H2B1J, and H2B1O were calculated to be 3.2:1.0:0.82, in agreement with the numbers derived from the resolved peaks in Figure 4B.

