
Figure 1. Behaviors During the Helping Task.
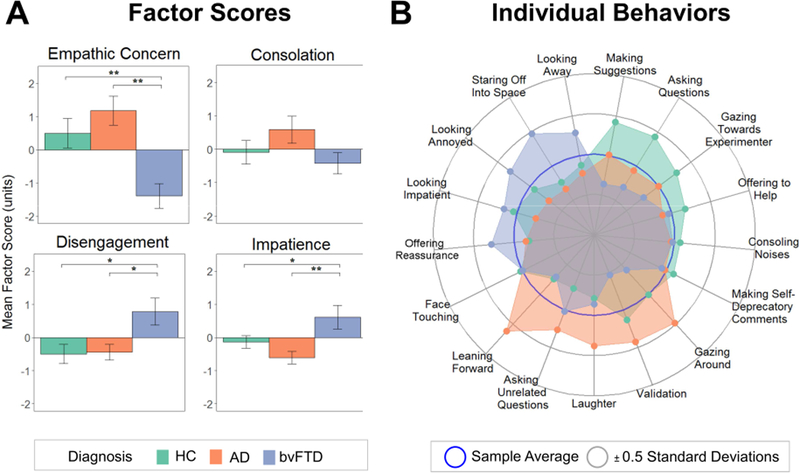
(A) Bar graphs depict each diagnostic group’s mean factor scores, which were derived from the verbal and non-verbal behaviors the participants exhibited during the helping task. Error bars are standard error of the mean. (B) The radial plot shows the individual behaviors that were included in the factor scores and their mean levels in each diagnostic group. AD= Alzheimer’s disease, bvFTD= behavioral variant frontotemporal dementia, HC= healthy controls.