Fig. 1.
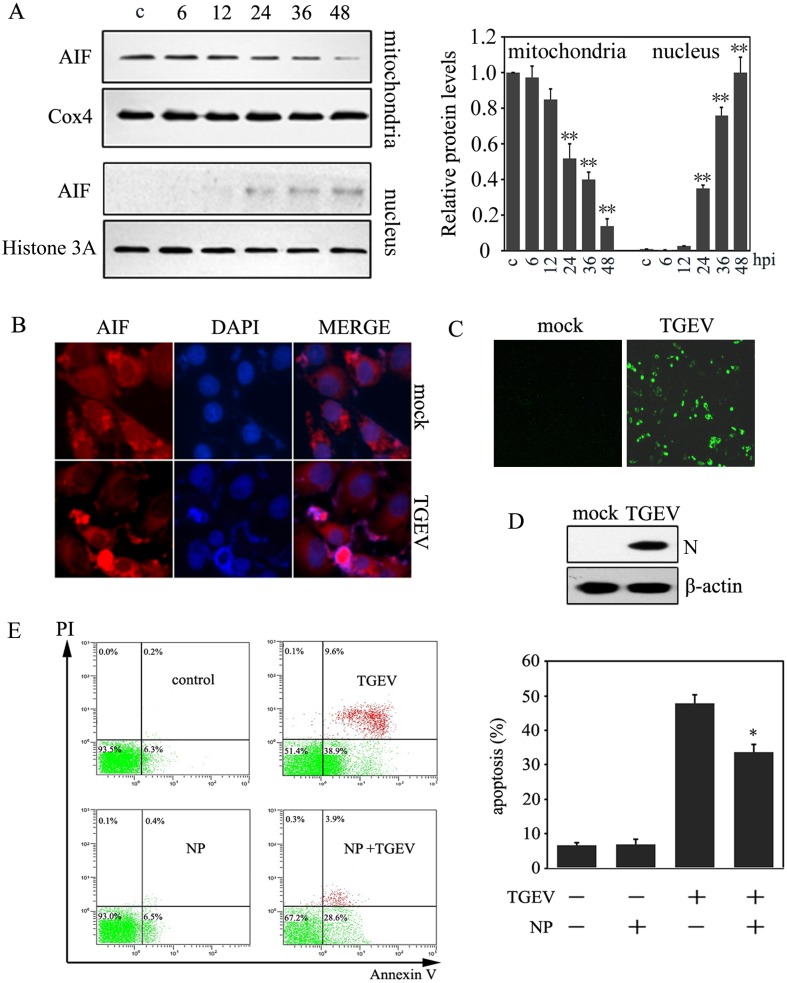
The activation of AIF during TGEV infection. (A) PK-15 cells were collected at different infection times (MOI=10). The mitochondrial and nuclear proteins were extracted, and the cell lysates were analyzed by Western blot. Histone H3 and Cox4 were used as nuclear and mitochondria internal controls, respectively. The protein expression of AIF in the mitochondria and nucleus was calculated by densitometry of the corresponding bands after normalization to Cox4 and histone, respectively (right panel). Results are expressed as means ± SD from three independent experiments. **P<0.01 versus control. (B) Cells were fixed for immunofluorescence when infected with TGEV for 36 hr post infection. AIF were stained red, and cellular nuclei were stained blue. (C) Cells were fixed for immunofluorescence when infected with TGEV for 36 hr post infection. TGEV N protein were stained green. (D) Cells were collected when infected with TGEV for 36 hr post infection, then were subjected to Western blot analysis for TGEV N protein. (E) The effect of the AIF inhibitor, NP, on apoptosis. Cells were incubated with 10 µM NP for 1 hr, and then were infected with TGEV for 36 hr, subsequently cells were subjected to flow cytometric analysis. The percentages shown are the proportion of apoptotic cells (right panel). *P<0.05 versus TGEV infection. All data are means ± SD of results from three independent experiments.

