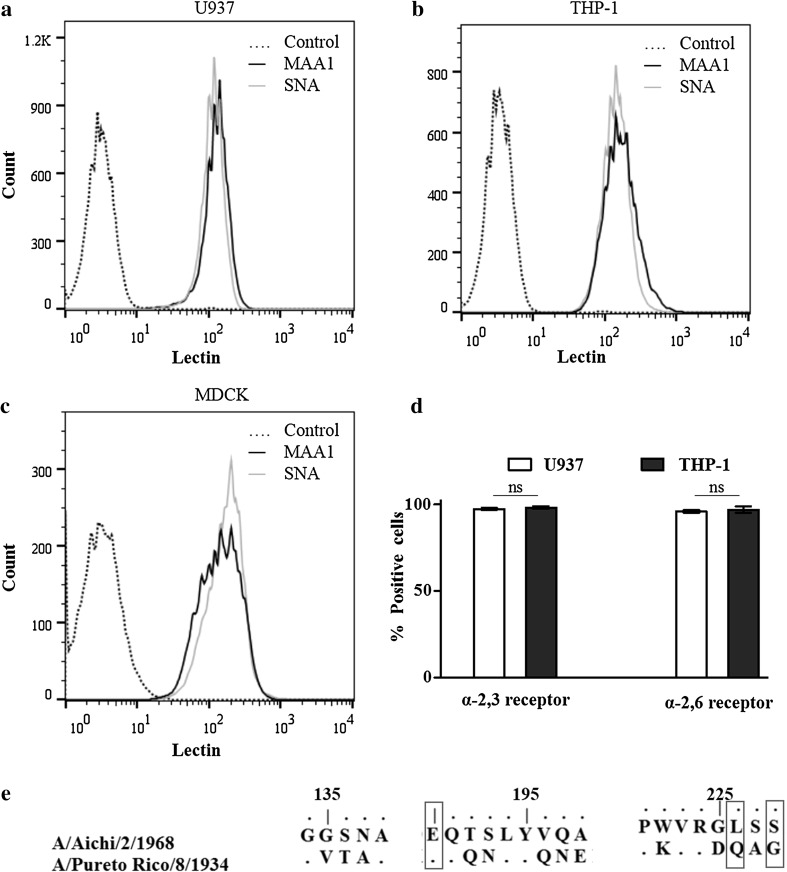
Fig. 2.
Cellular and viral factors determining the influenza virus sialic acid receptor preferences. Flow cytometry for determining cell surface sialic acid receptors distribution on monocytic or MDCK cells (a–d). Monocytic cells and MDCK cells are stained for α-2,3 sialic acid using MAA1-FITC or α-2,6 sialic acid using SNA-FITC and analysed by flow cytometry. Histogram shows U937 (a), THP-1 (b) or MDCK (c) cells that are positive for MAA1 or SNA. Bar diagram (d) shows average percentage (Mean ± SD) of monocytic cells positive for α-2,3 sialic acid or α-2,6 sialic acid from three independent experiments. Number of U937 and THP-1 cells positive for α-2,3 sialic acid or α-2,6 sialic acid receptors are comparable (ANOVA: ns, P > 0.050). Sequence alignment of hemagglutinin (HA) protein of H3N2 and PR8 (H1N1) virus (e). Only amino acids in the receptor binding domain of influenza HA protein are shown

