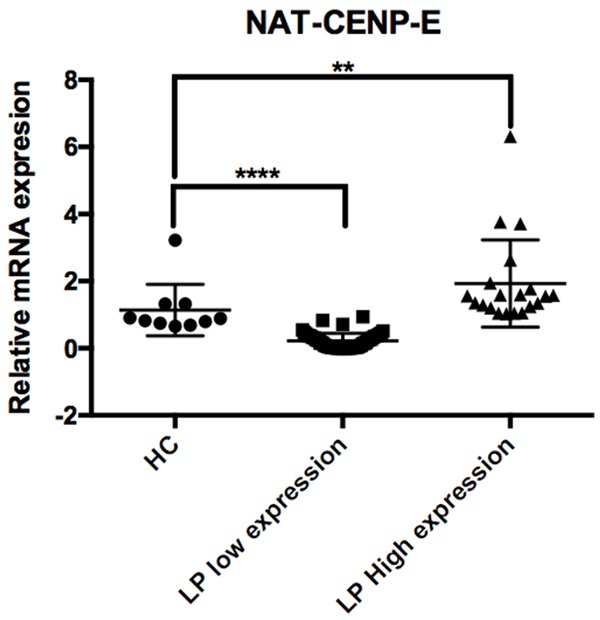
Figure 5.

Relative quantification of NAT-CENP-E in Acute Lymphoblastic Leukemia. Evaluation of NAT-CENP-E using Real Time RT-PCR. The plot showed the relative expression of 10 healthy donator and 71 LP. The LP were fractionated in low (n = 51, less to one-fold in gene expression P = 0.0001) and high expression (n = 20, more of one-fold in gene expression P = 0.0016) and were compared against to reference control.
