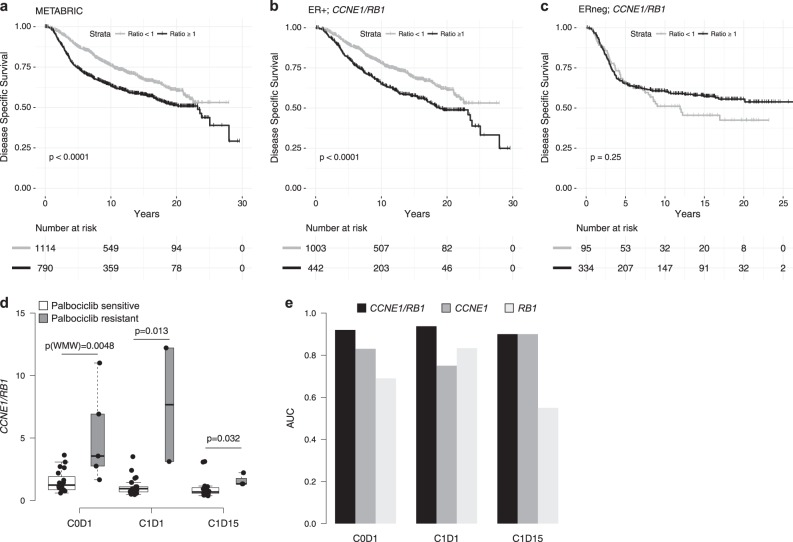
Fig. 6.
CCNE1/RB1 ratio as a poor prognostic factor and a marker of palbociclib resistance. a Kaplan–Meyer plot of METABRIC dataset22 (n = 1904). b Kaplan–Meyer plot of METABRIC ER+ samples (n = 1445). c Kaplan–Meyer plot of METABRIC ERneg samples (n = 429). Samples are divided into two groups according to the ratio of CCNE1 to RB1 expression. Cut-off is set to 1. P-values are calculated with log-rank test. d Box plot of the distributions of the ratio between gene expression level of CCNE1 to RB1 expression (CCNE1/RB1) in the NeoPalAna dataset23 for Palbociclib-sensitive (white) and resistant (gray) patients at the different time points. P-values are calculated by Wilcoxon–Mann–Whitney (WMW) test. e Bar plot showing the CCNE1/RB1 (dark gray), CCNE1 (gray), and RB1 (light gray) AUC values for discriminating between palbociclib-sensitive and resistant patients at the different time points

