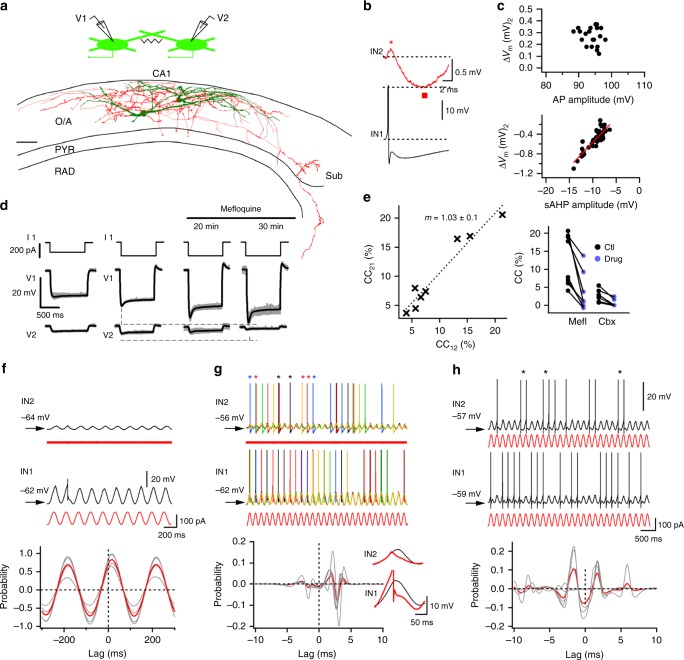
Fig. 3.
Electrical coupling between VIP-LRPs. a Schematic of the simultaneous recording of two VIP-LRPs and their reconstruction. Scale bar: 100 µm. b Representative example of the simultaneous recording of two VIP-LRPs with an AP initiated in one cell (IN1, black) and a corresponding voltage response in the second cell (IN2, red). The positive and negative components of the spikelet are shown with a star and square symbols, respectively. c Summary plots (n = 17 cells) indicating changes in the postsynaptic Vm as a function of the AP amplitude (upper) or sAHP amplitude (bottom). Red line is a linear fit to the data points (r = 0.88, Pearson correlation) for a spikelet component associated with sAHP in the presynaptic cell. d Representative examples of voltage traces recorded in the VIP-LRP pair before and after the application of mefloquine. e Summary plots for the coupling coefficient (CC) (left; m, slope of the regression line ± SE), and for the gap-junction blockers’ effect [right; Mefloquine (Mefl), n = 8; Carbenoxolone (Cbx) n = 6; p < 0.05; paired t-test]. f Voltage responses recorded in a VIP-LRP pair to a sinusoidal current (red trace, 5 Hz) applied to the IN1. The plot below shows cross-correlations in Vm between the two cells (n = 6 pairs), with red trace showing the average data. g Voltage responses (five consecutive traces of different colours superimposed) recorded in the VIP-LRP pair with the postsynaptic cell (IN2) being depolarized, and a sinusoidal current (red trace) applied to the IN1. Stars of different colours above the IN2 traces indicate APs generated synchronously in two cells. The plot below shows cross-correlations in the AP occurrence (n = 6 pairs), with red trace illustrating the average data. Insets on the right show voltage responses in two cells with (red trace) and without (black trace) an AP generated in the presynaptic cell. h Voltage responses recorded in a VIP-LRP pair to a sinusoidal current (red trace) applied to both cells. Stars above the IN2 trace indicate APs generated synchronously. The plot below shows cross-correlations in the AP occurrence (n = 6 pairs), with red trace showing the average data

