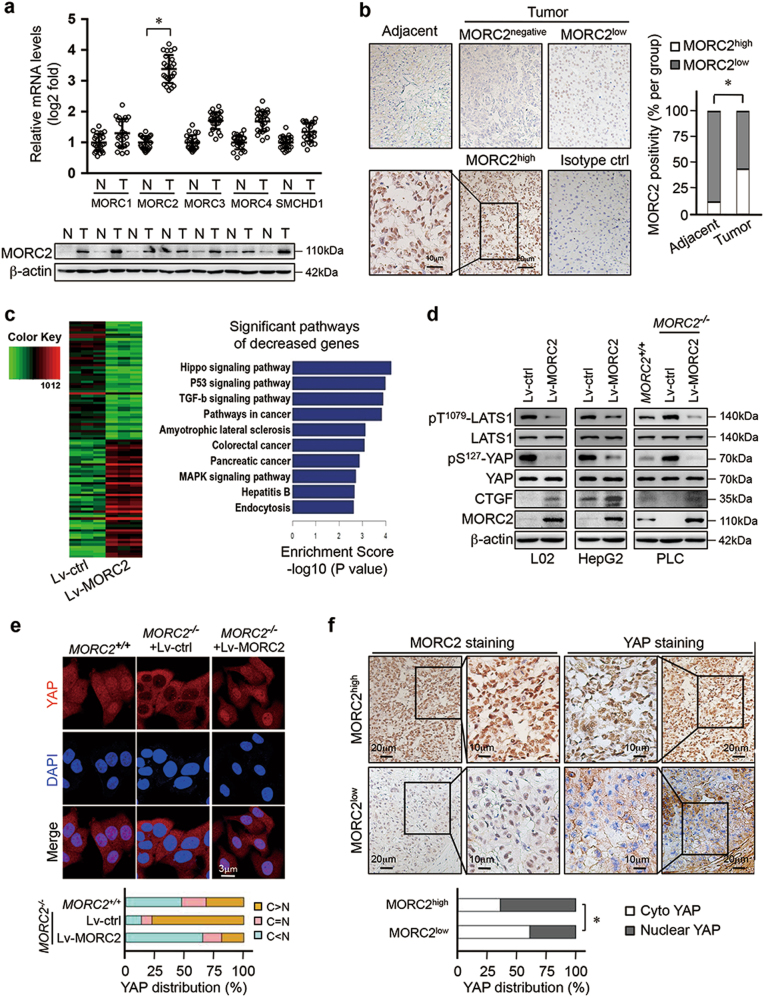
Fig. 1.
MORC2 inhibits the activity of Hippo signaling in HCC cells. a MORC2 is specifically elevated in liver cancer tissues. Analysis of MORC family member transcripts by qRT-PCR (upper panel) and MORC2 protein levels by western blot (lower panel) in HCC tumor and corresponding adjacent non-tumor tissues (N, non-tumor; T, tumor, n = 24 patients for qRT-PCR and n = 7 patients for western blot). b Immunohistochemistry (IHC) of MORC2 expression in liver cancer tissues. Left panel: representative IHC images showing low or high levels of anti-MORC2 staining (MORC2low or MORC2high). Right panel: quantitative analysis of anti-MORC2 staining revealing elevated expression of MORC2 in HCC samples. c Left panel: Heat maps illustrating differentially gene expression profiles of human immortalized hepatocyte L02 cells that were infected with control (Lv-ctrl) or MORC2-expressing (Lv-MORC2) lentivirus (n = 3 per biological repeats). Right panel: pathway analysis of downregulated genes in MORC2-expressing cells, as listed by enrichment score. d MORC2 suppresses Hippo signaling in HCC cells. Western blot analysis of Hippo core kinase activity in control or MORC2-expressing L02 and HepG2 cells, or various PLC cells (MORC2+/+ or MORC2−/− or MORC2−/− cells expressing ectopic MORC2). e Representative confocal microscopy images showing that MORC2 promotes YAP nuclear translocation in HCC cells. Quantitative analysis of YAP subcellular localization was provided in the lower panel. f MORC2 expression status correlates with YAP nuclear localization, as indicated by anti-MORC2 and anti-YAP IHC staining, in HCC tissues. Quantitative analysis of anti-MORC2 staining and YAP nuclear staining was provided in the lower panel (n = 100 patients). Data are presented as the mean ± SD from three separate experiments (a). Representative images are shown in a, b, d–f. *P < 0.05

