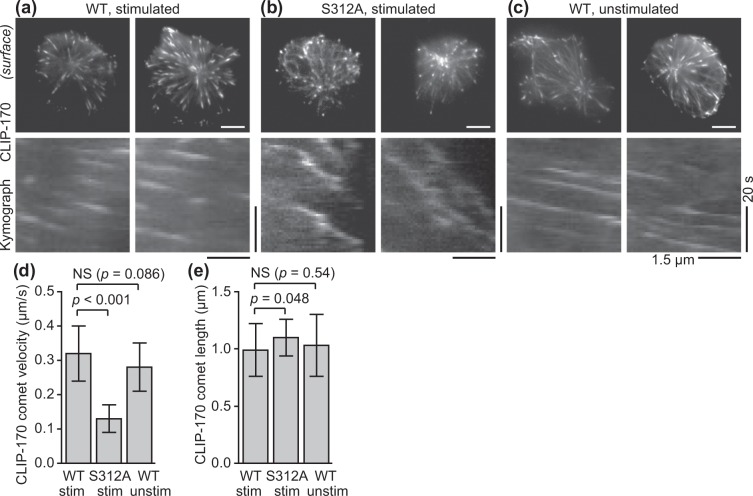
Figure 3.
CLIP-170 phosphorylation up-regulates microtubule plus-end dynamics, but T cell stimulation does not. (a–c) TIRF live-cell images (top) and kymographs (bottom) of CLIP-170 comets and microtubule plus-end dynamics visualised using C-terminal mEGFP-tagged CLIP-170s: wild-type in stimulated cells (a), S312A mutant in stimulated cells (b), and wild-type in unstimulated cells (c) (see Movie S1). (d,e) The velocity (d) and the length (e) of CLIP-170 comets, quantified using the images. Bars in TIRF images, 5 μm; horizontal and vertical bars in kymographs, 1.5 μm and 20 s, respectively. Data are means ± SD. Source data, Table S4.

