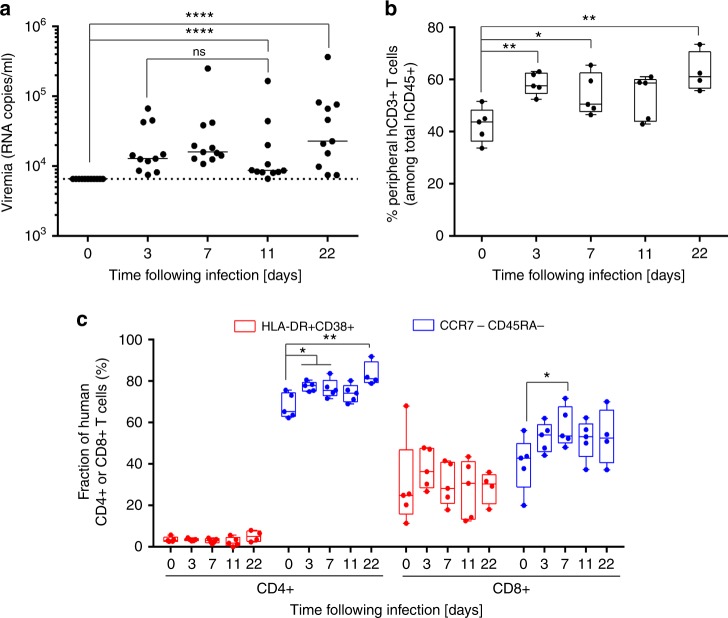
Fig. 1.
NRG-HIS mice do not clear YFV-17D infection. a YFV-17D serum viremia in the peripheral blood of NRG-HIS mice over the course of infection. (+) RNA copies per ml were quantified by RT-qPCR. Limit of detection (dotted line) is shown. Horizontal lines represent median viremia at each time point (n = 12). ****p ≤ 0.0001, ns non-significant (Wilcoxon–Mann–Whitney test). b Percentage of peripheral human CD3+ T cells among the total human CD45+ cell population in the blood of NRG-HIS mice over the course of YFV-17D infection. Bounds of box and whiskers represent the min-to-max fraction of peripheral human CD3+ T cell among total human CD45+ at each time point. Medians are indicated in each box as center line (n = 5) *p ≤ 0.05, **p ≤ 0.01 (Student’s t test). c Fraction of peripheral human CD4+ and CD8+ T cells co-expressing HLA-DR and CD38 (red) or lacking expression of both CCR7 and CD45RA (blue) in the blood of NRG-HIS mice over the course of YFV-17D infection. Bounds of box and whiskers represent the min-to-max fraction of human CD4+ or CD8+ T cell for each marker combination and time point. Medians are indicated in each box as center line (n = 5). *p ≤ 0.05, **p ≤ 0.01 (Student’s t test)

