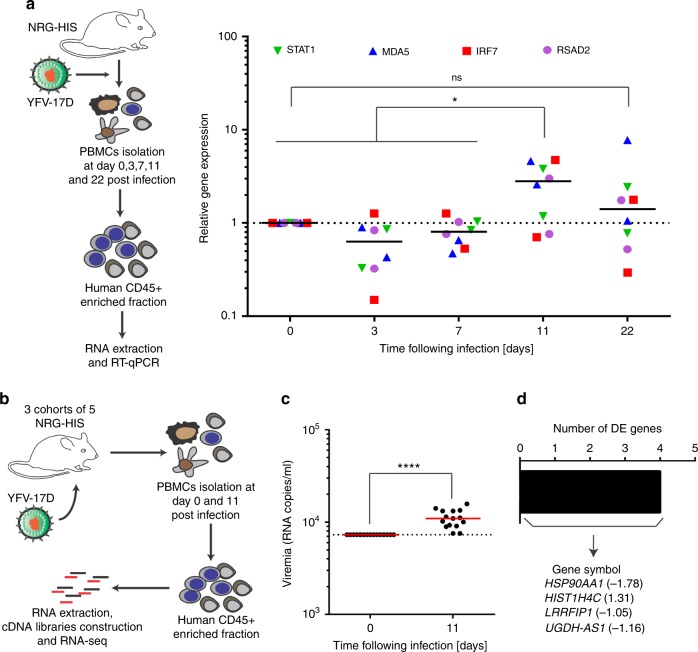
Fig. 2.
Limited transcriptomic response to YFV-17D infection in NRG-HIS mice. a Relative expression of a set of four anti-viral genes (green, STAT1; blue, MDA5; red, IRF7; and purple, RSAD2) in the PBMCs of NRG-HIS mice following infection with YFV-17D. Expression of each gene was assessed by RT-qPCR in human peripheral CD45+ cells at different time points post infection (day 0, 3, 7, 11, and 22 post infection). Each dot represents the average expression of a given gene within a cohort of 4 NRG-HIS mice. For each time point, the grand median is shown and represent the median of the cumulated expression of the four genes. Dotted line represents the gene expression level at baseline (n = 2 cohorts of four NRG-HIS mice each). *p ≤ 0.05, ns non-significant (two-way ANOVA). b Schematic representation of the procedure to characterize the PBMC transcriptomic signature of NRG-HIS mice following YFV-17D infection. c YFV-17D serum viremia at days 0 and 11 post infection in the NRG-HIS mice used for transcriptomic profiling. (+) RNA copies per ml were quantified by RT-qPCR. Red horizontal lines represent median viremia at each time point. Limit of detection (dotted line) is shown (n = 15). ****p ≤ 0.001 (Wilcoxon–Mann–Whitney test). d Number of significantly differentially expressed (DE) genes (padj ≤ 0.05) in the PBMCs of NRG-HIS mice following YFV-17D infection. The names of the only four DE genes is depicted, followed with their respective log2 fold change

