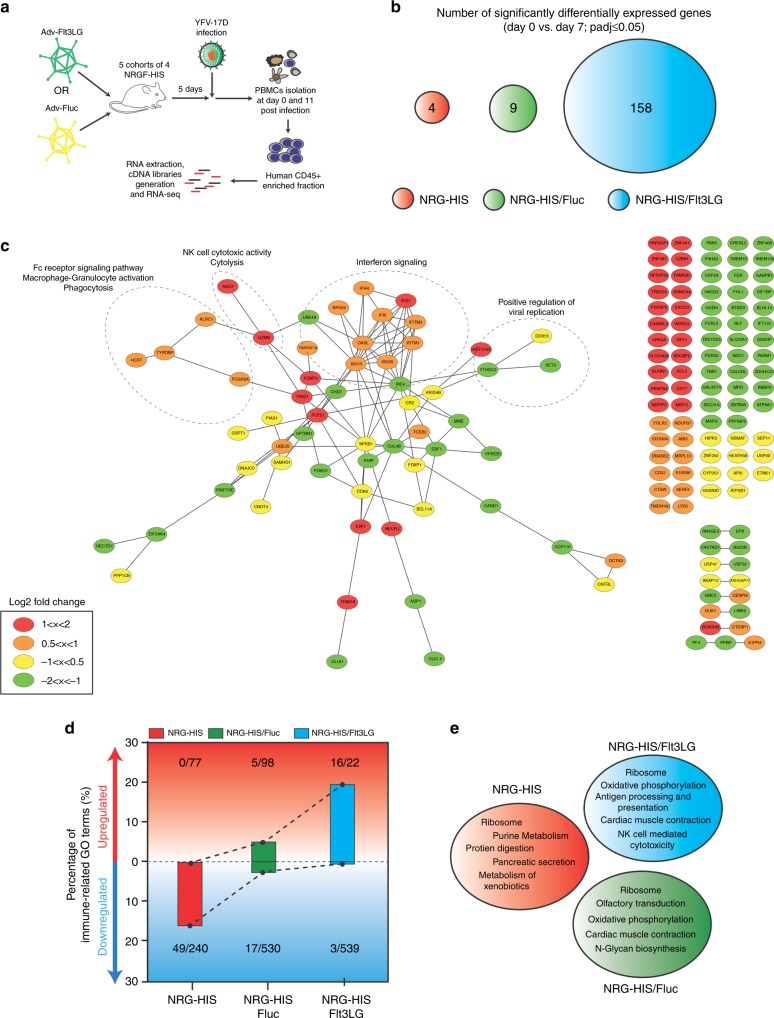
Fig. 4.
NRGF-HIS/Flt3LG mice display an extensive transcriptomic signature. a Schematic representation of the experimental procedure to characterize the PBMC transcriptomic signature of NRGF-HIS mice following YFV-17D infection. b Number of significantly DE genes (padj ≤ 0.05) at day 11 post YFV-17D infection (versus day 0, prior infection) in the PBMCs of NRG-HIS (red), NRGF-HIS/Fluc (green), and NRGF-HIS/Flt3LG (blue) mouse PBMCs upon YFV-17D infection. c Protein–protein network of significantly DE (padj ≤ 0.05) in NRGF-HIS mice following YFV-17D infection. Each gene is colored based on its log2FC (1 < x < 2, red; 0.5 < x < 1, orange; −1 < x < −0.5, yellow; −2 < x < −1, green). Areas enriched with genes related to a specific biological process are highlighted by a dotted circle or ellipse. d Frequencies of upregulated (red area) or downregulated (blue area) immune-related GO terms among all statistically significant GO terms (p ≤ 0.05) in NRG-HIS (red), NRGF-HIS/Fluc (green), and NRGF-HIS/Flt3LG (blue) mice following replicate analysis. Total count of immune-related GO-terms out of all significant GO terms (displayed as immune-related/all) are also reported. Dotted lines between the bars symbolize the progressive enhancement of human immune functionality across our humanized mice models. e KEGG pathway enrichment analysis of the transcriptomes of NRG-HIS (red), NRGF-HIS/Fluc (green), and NRGF-HIS/Flt3LG (blue) mouse PBMCs following replicate analysis. For each experimental setting or mouse model, the top five upregulated KEGG pathways are listed (q value ≤ 0.06)

