Fig. 7.
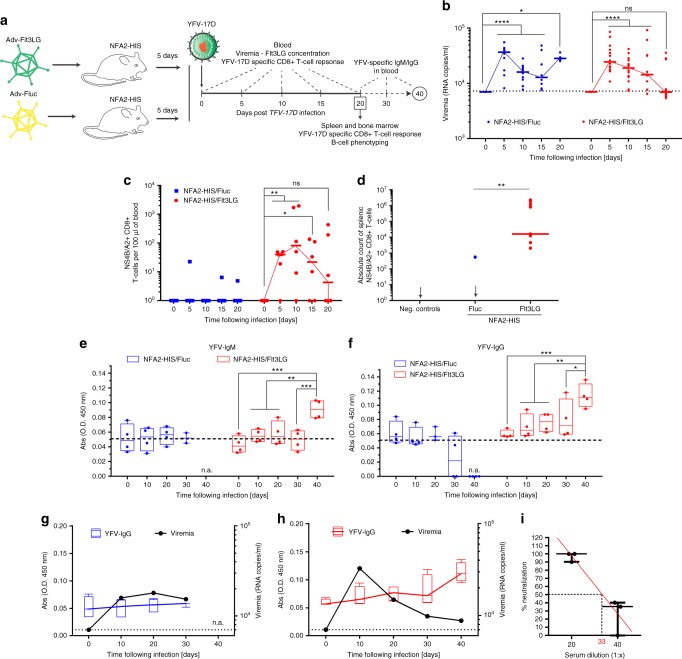
NFA2-HIS/Flt3LG mice mount YFV-specific cellular and humoral response. a Schematic representation of the NFA2-HIS mice time course infection experiment. b YFV-17D serum viremia in the peripheral blood of NFA2-HIS/Fluc (blue, n = 10) and NFA2-HIS/Flt3LG (red, n = 14) mice over the course of infection. (+) RNA copies per ml were quantified by RT-qPCR. Limit of detection (dotted line) is shown. Horizontal lines represent median viremia at each time point. *p ≤ 0.05, ****p ≤ 0.0001, ns non-significant (Wilcoxon–Mann–Whitney test). c Absolute cell count of peripheral YFV-specific CD8+ T cells (NS4B/A2+) in the blood of NFA2-HIS/Fluc and NFA2-HIS/Flt3LG mice over the course of YFV-17D infection. Cell counts are shown as per 100 μl of total blood. Horizontal lines represent median cell count at each time point (n = 4–6). *p ≤ 0.05, **p ≤ 0.01, ns non-significant (Wilcoxon–Mann–Whitney test). d Absolute count of YFV-specific CD8+ T cells (NS4B/A2+) in the spleen of NFA2-HIS/Fluc and NFA2-HIS/Flt3LG mice at day 20 post infection. Negative controls represent one non-infected NFA2-HIS/Flt3LG mouse and two infected NRGF-HIS/Flt3LG mice (that do not express HLA-A2). Horizontal lines represent median cell count (n = 4–11). **p ≤ 0.01 (Wilcoxon–Mann–Whitney test). e, f Relative concentration of human anti-YFV-17D IgM (e) and IgG (f) antibodies in the serum of NFA2-HIS/Fluc (blue, n = 4) and NFA2-HIS/Flt3LG mice (red, n = 4) over a 6-weeks course of infection. **p ≤ 0.01, ***p ≤ 0.001, ns non-significant (Wilcoxon–Mann–Whitney test). n.a. non applicable as no mice were analyzed at the time of serum collection. g, h Correlation between YFV-17D viremia (black line) and YFV-IgG relative concentration (colored box and whisker) in the serum of NFA2-HIS/Fluc (g) and NFA2-HIS/Flt3LG (h) over a 6-weeks course of infection (n = 4 per group). Medians in each box and whisker are connected together by a colored line (blue for NFA2-HIS/Fluc and red for NFA2-HIS/Flt3LG). Viremia limit of detection (dotted line) is shown. n.a. non applicable as no mice in the control group were alive at the time of serum collection. For panels (e–h), bounds of box and whiskers represent the min-to-max absorbance value at each time point. Medians are indicated in each box as center line. i Quantification of YFV-neutralizing activity in the serum of NFA2-NRGF-HIS/Flt3LG mice. Serum neutralizing activity is represented as percentage of YFV-17D infection inhibition (% neutralization). Medians with ranges (min-to-max percentage of neutralization) for both serum dilution are shown (n = 3). A linear regression (red line) of the average neutralization activity is shown and was used to determine the median neutralization titer (50% inhibition, red number on the x-axis)

