Fig. 9.
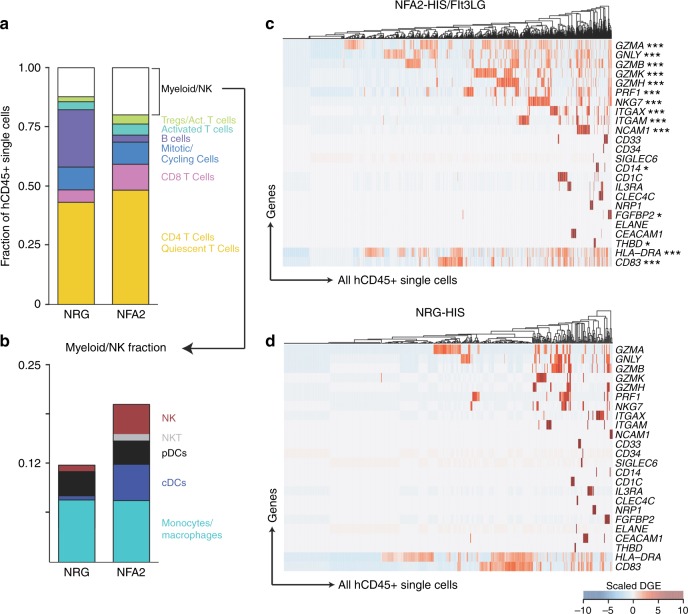
ScRNA-Seq-based measurement of the myeloid and NK cell engraftment. a, b Chart bart displaying the fraction of human cell subsets within the hCD45+ compartment in both NRG-HIS and NFA2-HIS/Flt3LG mouse spleens (a). The fraction of multiple myeloid and NK subsets is highlighted within a second chart bart (b). Cell subsets are colored as in Fig. 8a, c. c, d Heatmap of all hCD45+ single cells in NFA2-HIS/Flt3LG (c) and NRG-HIS (d) mice over myeloid, DC, NK, and granulocyte subpopulation-defining genes. Differentially expressed genes between NRG-HIS and NFA2-HIS/Flt3LG mice are shown in (c) (*p ≤ 0.05, **p ≤ 0.01, ***p ≤ 0.001; Benjamini–Hochberg adjusted p-values). Tregs regulatory T cells, NK natural killer cells, NKT natural killer T cells, DCs dendritic cells, cDCs conventional dendritic cells, pDCs plasmacytoid dendritic cells

